Estimated Value: $722,062 - $784,000
5
Beds
2
Baths
1,488
Sq Ft
$504/Sq Ft
Est. Value
About This Home
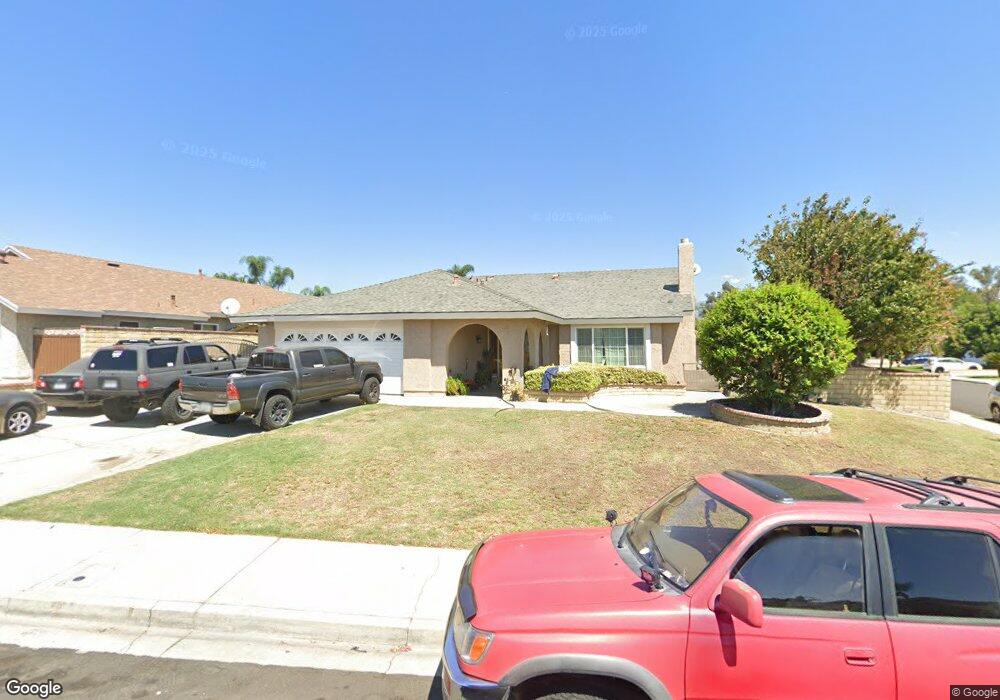
This home is located at 6526 Fillmore St, Chino, CA 91710 and is currently estimated at $749,516, approximately $503 per square foot. 6526 Fillmore St is a home located in San Bernardino County with nearby schools including Alicia Cortez Elementary, Magnolia Junior High, and Chino High School.
Ownership History
Date
Name
Owned For
Owner Type
Purchase Details
Closed on
Feb 24, 2019
Sold by
Sunset West Capital Llc
Bought by
The Patricia I Carmell Family Trust
Current Estimated Value
Purchase Details
Closed on
Jun 28, 2018
Sold by
Carmell Patricia I
Bought by
Sunset West Capital Llc
Purchase Details
Closed on
Feb 18, 2002
Sold by
Carmell Patricia L
Bought by
Carmell Patricia I and The Patricia I Carmell Family
Create a Home Valuation Report for This Property
The Home Valuation Report is an in-depth analysis detailing your home's value as well as a comparison with similar homes in the area
Home Values in the Area
Average Home Value in this Area
Purchase History
| Date | Buyer | Sale Price | Title Company |
|---|---|---|---|
| The Patricia I Carmell Family Trust | -- | None Available | |
| Sunset West Capital Llc | -- | None Available | |
| Carmell Patricia I | -- | -- |
Source: Public Records
Tax History Compared to Growth
Tax History
| Year | Tax Paid | Tax Assessment Tax Assessment Total Assessment is a certain percentage of the fair market value that is determined by local assessors to be the total taxable value of land and additions on the property. | Land | Improvement |
|---|---|---|---|---|
| 2025 | $1,821 | $165,897 | $33,312 | $132,585 |
| 2024 | $1,821 | $162,644 | $32,659 | $129,985 |
| 2023 | $1,771 | $159,455 | $32,019 | $127,436 |
| 2022 | $1,761 | $156,328 | $31,391 | $124,937 |
| 2021 | $1,726 | $153,262 | $30,775 | $122,487 |
| 2020 | $1,704 | $151,690 | $30,459 | $121,231 |
| 2019 | $1,675 | $148,716 | $29,862 | $118,854 |
| 2018 | $1,638 | $145,800 | $29,276 | $116,524 |
| 2017 | $1,609 | $142,941 | $28,702 | $114,239 |
| 2016 | $1,505 | $140,138 | $28,139 | $111,999 |
| 2015 | $1,475 | $138,033 | $27,716 | $110,317 |
| 2014 | $1,446 | $135,329 | $27,173 | $108,156 |
Source: Public Records
Map
Nearby Homes
- 6703 Poinsettia Ct
- 6542 Hamilton St
- 6763 Poinsettia Ct
- 6736 Aster Ct
- 12689 Cypress Ave
- 12476 Park Ave
- 12482 Silkleaf Ave
- 926 W Philadelphia St Unit 49
- 926 W Philadelphia St Unit R99
- 926 W Philadelphia St Unit 10
- 558 W Philadelphia St
- 320 W Walnut St Unit 6
- 6630 Mogano Dr
- 6766 Foxcroft Ct
- 6648 Riverside Dr Unit 3
- 12321 Gardenia Place
- 2321 S Magnolia Ave Unit 6E
- 114 Cormorant Dr
- 12834 Zinnea Ave
- 12947 Robin Ln
- 6520 Fillmore St
- 12384 Lime Place
- 12372 Lime Place
- 12385 Cypress Ave
- 6510 Fillmore St
- 12428 Lime Place
- 12397 Lime Place
- 6557 Fillmore St
- 12373 Cypress Ave
- 12385 Lime Place
- 12427 Cypress Ave
- 12360 Lime Place
- 12436 Lime Place
- 12373 Lime Place
- 6565 Fillmore St
- 12361 Cypress Ave
- 12437 Lime Place
- 12439 Cypress Ave
- 12398 Kumquat Place
- 12361 Lime Place