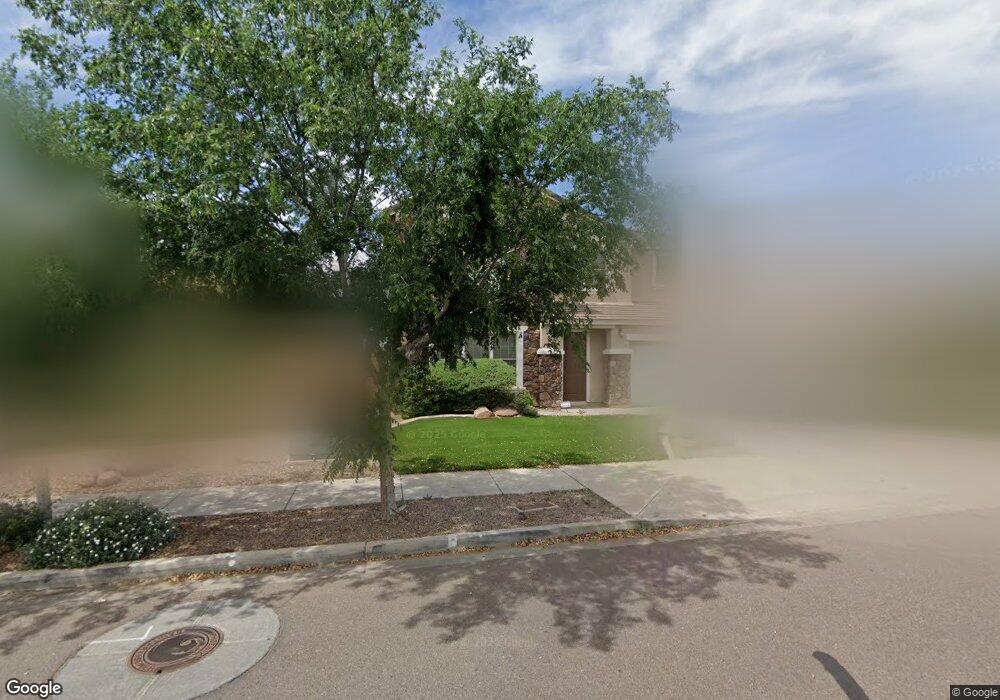
6526 S 41st Ln Phoenix, AZ 85041
Laveen NeighborhoodEstimated Value: $463,250 - $579,000
3
Beds
3
Baths
3,553
Sq Ft
$146/Sq Ft
Est. Value
About This Home
This home is located at 6526 S 41st Ln, Phoenix, AZ 85041 and is currently estimated at $518,063, approximately $145 per square foot. 6526 S 41st Ln is a home located in Maricopa County with nearby schools including Cesar Chavez High School, Phoenix Coding Academy, and Legacy Traditional School - Laveen Village.
Ownership History
Date
Name
Owned For
Owner Type
Purchase Details
Closed on
Feb 3, 2010
Sold by
Fannie Mae
Bought by
Jackson Herschel
Current Estimated Value
Home Financials for this Owner
Home Financials are based on the most recent Mortgage that was taken out on this home.
Original Mortgage
$154,156
Outstanding Balance
$101,514
Interest Rate
4.93%
Mortgage Type
FHA
Estimated Equity
$416,549
Purchase Details
Closed on
May 6, 2009
Sold by
Garcia Israel and Garcia Jessenia M
Bought by
Federal National Mortgage Association
Purchase Details
Closed on
Mar 7, 2006
Sold by
Trend Homes Inc
Bought by
Garcia Israel and Garcia Jessenia M
Home Financials for this Owner
Home Financials are based on the most recent Mortgage that was taken out on this home.
Original Mortgage
$389,524
Interest Rate
6.08%
Mortgage Type
New Conventional
Purchase Details
Closed on
Jun 28, 2005
Sold by
Inca Capital Fund 36 Llc
Bought by
Trend Homes Inc
Create a Home Valuation Report for This Property
The Home Valuation Report is an in-depth analysis detailing your home's value as well as a comparison with similar homes in the area
Home Values in the Area
Average Home Value in this Area
Purchase History
| Date | Buyer | Sale Price | Title Company |
|---|---|---|---|
| Jackson Herschel | $157,000 | Lawyers Title Of Arizona Inc | |
| Federal National Mortgage Association | $335,712 | None Available | |
| Garcia Israel | $486,906 | Chicago Title Insurance Co | |
| Trend Homes Inc | $2,078,500 | -- |
Source: Public Records
Mortgage History
| Date | Status | Borrower | Loan Amount |
|---|---|---|---|
| Open | Jackson Herschel | $154,156 | |
| Previous Owner | Garcia Israel | $389,524 |
Source: Public Records
Tax History Compared to Growth
Tax History
| Year | Tax Paid | Tax Assessment Tax Assessment Total Assessment is a certain percentage of the fair market value that is determined by local assessors to be the total taxable value of land and additions on the property. | Land | Improvement |
|---|---|---|---|---|
| 2025 | $2,827 | $19,943 | -- | -- |
| 2024 | $2,721 | $18,993 | -- | -- |
| 2023 | $2,721 | $37,080 | $7,410 | $29,670 |
| 2022 | $2,639 | $28,310 | $5,660 | $22,650 |
| 2021 | $2,659 | $26,710 | $5,340 | $21,370 |
| 2020 | $2,589 | $24,650 | $4,930 | $19,720 |
| 2019 | $2,596 | $23,130 | $4,620 | $18,510 |
| 2018 | $2,469 | $21,260 | $4,250 | $17,010 |
| 2017 | $2,335 | $19,110 | $3,820 | $15,290 |
| 2016 | $2,215 | $18,210 | $3,640 | $14,570 |
| 2015 | $1,996 | $17,980 | $3,590 | $14,390 |
Source: Public Records
Map
Nearby Homes
- 4318 W Apollo Rd
- 4335 W Apollo Rd
- 4140 W Burgess Ln
- 4320 W Alta Vista Rd
- 4323 W Darrel Rd
- 4332 W Carson Rd
- 4315 W Carson Rd
- 6310 S 44th Ave
- 7035 S 43rd Dr
- 4330 W T Ryan Ln Unit 2
- 4321 W Hasan Dr
- 6812 S 45th Ave
- 5807 S 13th Ave
- 4505 W Burgess Ln
- 4001 W Southern Ave Unit 50
- 3927 W Southern Ave
- 6915 S 46th Dr
- 4519 W Pleasant Ln
- 4409 W Dunbar Dr
- 5649 S 42nd Ave Unit 50
- 6604 S 41st Ln
- 6522 S 41st Ln
- 6606 S 41st Ln
- 6615 S 42nd Dr
- 6518 S 41st Ln
- 6610 S 41st Ln
- 4134 W Saint Anne Ave
- 6614 S 41st Ln
- 6514 S 41st Ln
- 4135 W Saint Anne Ave
- 4130 W Saint Anne Ave
- 6618 S 41st Ln
- 4131 W Saint Anne Ave
- 6510 S 41st Ln
- 4133 W Lydia Ln
- 6620 S 42nd Dr
- 4132 W Saint Charles Ave
- 4126 W Saint Anne Ave
- 4129 W Lydia Ln
- 6622 S 41st Ln