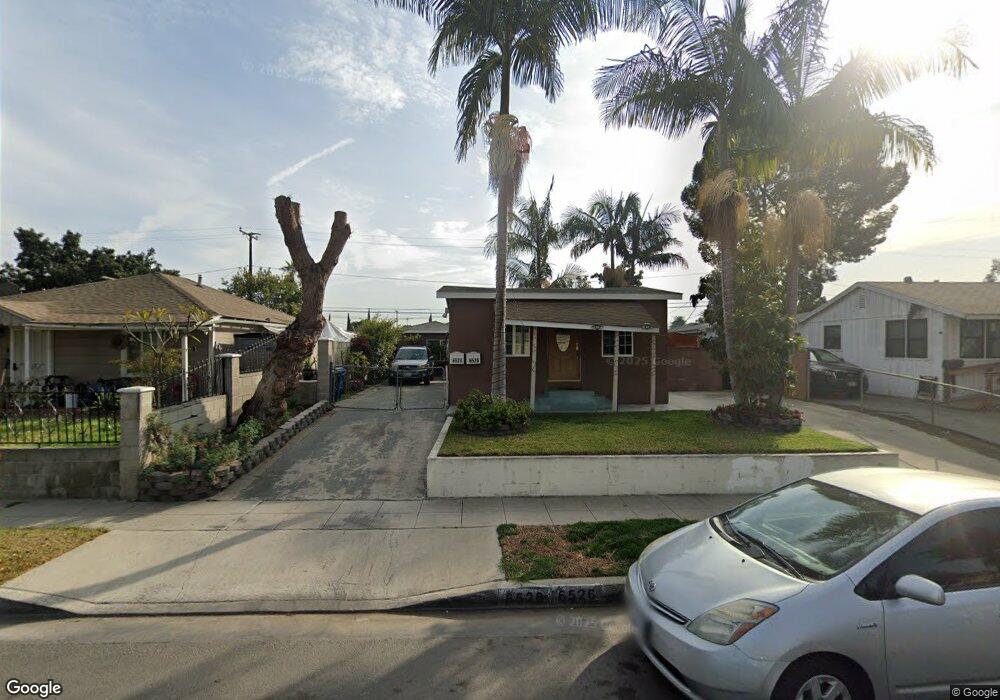
6526 San Miguel St Paramount, CA 90723
Estimated Value: $684,000 - $769,000
4
Beds
2
Baths
1,675
Sq Ft
$431/Sq Ft
Est. Value
About This Home
This home is located at 6526 San Miguel St, Paramount, CA 90723 and is currently estimated at $722,482, approximately $431 per square foot. 6526 San Miguel St is a home located in Los Angeles County with nearby schools including Los Cerritos School, Frank J. Zamboni School, and Paramount High School.
Ownership History
Date
Name
Owned For
Owner Type
Purchase Details
Closed on
Dec 16, 2021
Sold by
Avila Jose Q and Quintero Jose Avila
Bought by
Quintero Jose Avila and Avila Ruby
Current Estimated Value
Home Financials for this Owner
Home Financials are based on the most recent Mortgage that was taken out on this home.
Original Mortgage
$395,000
Outstanding Balance
$362,659
Interest Rate
2.98%
Mortgage Type
New Conventional
Estimated Equity
$359,823
Purchase Details
Closed on
Apr 12, 2019
Sold by
Avila Martha
Bought by
Avila Jose Q
Purchase Details
Closed on
May 22, 2002
Sold by
Bugarin Bernarda and Cortez Maria Guadalupe
Bought by
Avila Jose and Avila Martha
Home Financials for this Owner
Home Financials are based on the most recent Mortgage that was taken out on this home.
Original Mortgage
$177,450
Interest Rate
6.7%
Purchase Details
Closed on
Jun 10, 2001
Sold by
Bugarin Antonio Cortez
Bought by
Bugarin Bernarda and Cortez Maria Guadalupe
Create a Home Valuation Report for This Property
The Home Valuation Report is an in-depth analysis detailing your home's value as well as a comparison with similar homes in the area
Home Values in the Area
Average Home Value in this Area
Purchase History
| Date | Buyer | Sale Price | Title Company |
|---|---|---|---|
| Quintero Jose Avila | -- | None Listed On Document | |
| Avila Jose Q | -- | Stewart Title | |
| Avila Jose | $195,000 | Fidelity National Title | |
| Bugarin Bernarda | -- | -- |
Source: Public Records
Mortgage History
| Date | Status | Borrower | Loan Amount |
|---|---|---|---|
| Open | Quintero Jose Avila | $395,000 | |
| Previous Owner | Avila Jose | $177,450 |
Source: Public Records
Tax History Compared to Growth
Tax History
| Year | Tax Paid | Tax Assessment Tax Assessment Total Assessment is a certain percentage of the fair market value that is determined by local assessors to be the total taxable value of land and additions on the property. | Land | Improvement |
|---|---|---|---|---|
| 2025 | $4,108 | $282,401 | $130,338 | $152,063 |
| 2024 | $4,108 | $276,865 | $127,783 | $149,082 |
| 2023 | $4,037 | $271,437 | $125,278 | $146,159 |
| 2022 | $3,934 | $266,116 | $122,822 | $143,294 |
| 2021 | $3,843 | $260,899 | $120,414 | $140,485 |
| 2020 | $3,763 | $258,225 | $119,180 | $139,045 |
| 2019 | $3,926 | $253,163 | $116,844 | $136,319 |
| 2018 | $3,615 | $248,200 | $114,553 | $133,647 |
| 2016 | $3,254 | $238,563 | $110,105 | $128,458 |
| 2015 | $3,080 | $234,981 | $108,452 | $126,529 |
| 2014 | $3,156 | $230,379 | $106,328 | $124,051 |
Source: Public Records
Map
Nearby Homes
- 6556 San Vincente St
- 6626 San Miguel St
- 6846 San Vincente St
- 7029 Somerset Blvd
- 14708 S Frailey Ave
- 15325 Orange Ave
- 4704 E Compton Blvd
- 15118 S Frailey Ave
- 15351 Orange Ave Unit 25
- 15006 S Lime Ave
- 15311 Gundry Ave Unit 2
- 15311 Gundry Ave Unit 16
- 15311 Gundry Ave Unit 29
- 14712 Atlantic Ave
- 5506 Pelleur St
- 12323 Edgebrook Ave
- 7221 Petrol St Unit 6
- 15310 S Lime Ave
- 4636 Cardwell St
- 4539 Arlington Ave
- 6522 San Miguel St
- 6532 San Miguel St
- 6538 San Miguel St
- 6516 San Miguel St
- 6518 San Miguel St
- 6529 San Vincente St
- 6533 San Vincente St
- 6523 San Vincente St
- 6512 San Miguel St
- 6540 San Miguel St
- 6537 San Vincente St
- 6519 San Vincente St
- 6527 San Miguel St
- 6521 San Miguel St
- 6533 San Miguel St
- 6541 San Vincente St
- 6511 San Vincente St
- 6517 San Miguel St
- 6546 San Miguel St
- 6506 San Miguel St