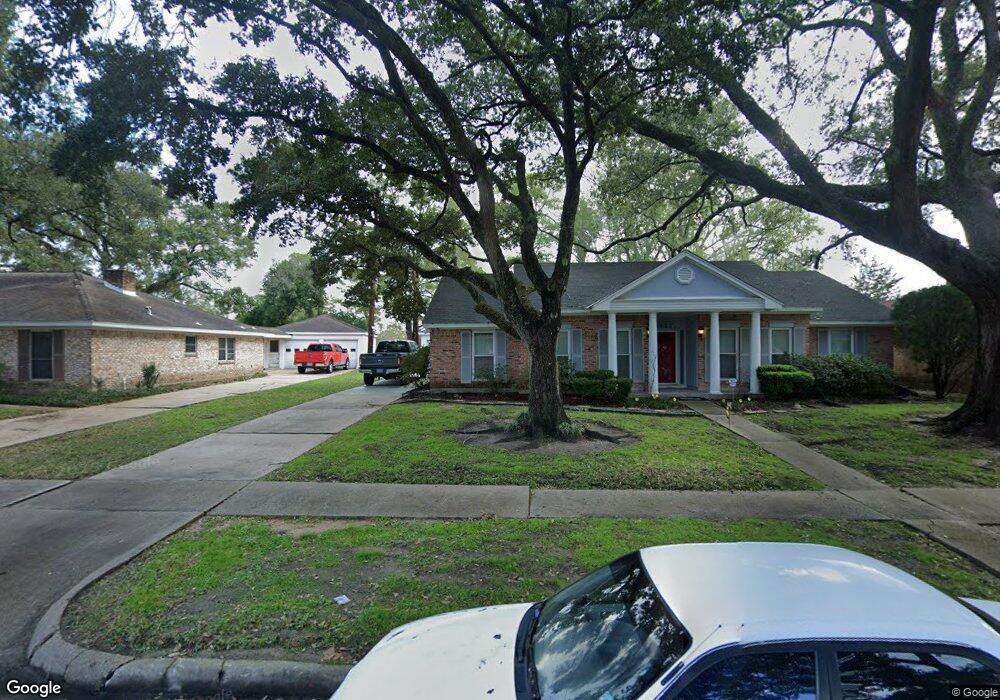
6527 Burning Tree Dr Unit A108 Houston, TX 77036
Sharpstown NeighborhoodEstimated Value: $311,221 - $341,000
4
Beds
2
Baths
2,134
Sq Ft
$153/Sq Ft
Est. Value
About This Home
This home is located at 6527 Burning Tree Dr Unit A108, Houston, TX 77036 and is currently estimated at $326,555, approximately $153 per square foot. 6527 Burning Tree Dr Unit A108 is a home located in Harris County with nearby schools including Neff Elementary School, Sugar Grove Academy, and Sharpstown High School.
Ownership History
Date
Name
Owned For
Owner Type
Purchase Details
Closed on
Nov 7, 2000
Sold by
Office Mary Ann
Bought by
Hartz Charles Alan
Current Estimated Value
Purchase Details
Closed on
Jan 23, 1998
Sold by
Fontenot Joanna F
Bought by
Hartz Charles Alan
Purchase Details
Closed on
Nov 11, 1997
Sold by
Rainwater Susan Lee
Bought by
Hartz Charles Alan
Purchase Details
Closed on
Jul 23, 1997
Sold by
Hartz Jamie
Bought by
Hartz Charles Alan
Purchase Details
Closed on
Dec 3, 1996
Sold by
Hartz Jamie
Bought by
Hartz Charles Alan
Purchase Details
Closed on
Nov 12, 1996
Sold by
Hartz Jamie
Bought by
Hartz Charles Alan
Purchase Details
Closed on
Feb 7, 1995
Sold by
Key Bank Of New York Na
Bought by
Hartz Charles Alan
Purchase Details
Closed on
Nov 22, 1994
Sold by
Mccall Bess
Bought by
Hartz Charles Alan and Braxton Lauren Clark
Create a Home Valuation Report for This Property
The Home Valuation Report is an in-depth analysis detailing your home's value as well as a comparison with similar homes in the area
Home Values in the Area
Average Home Value in this Area
Purchase History
| Date | Buyer | Sale Price | Title Company |
|---|---|---|---|
| Hartz Charles Alan | $15,000 | -- | |
| Hartz Charles Alan | $10,000 | -- | |
| Hartz Charles Alan | $10,000 | -- | |
| Hartz Charles Alan | $22,000 | -- | |
| Hartz Charles Alan | $20,000 | -- | |
| Hartz Charles Alan | $18,860 | -- | |
| Hartz Charles Alan | -- | American Title Co | |
| Hartz Charles Alan | -- | -- |
Source: Public Records
Tax History Compared to Growth
Tax History
| Year | Tax Paid | Tax Assessment Tax Assessment Total Assessment is a certain percentage of the fair market value that is determined by local assessors to be the total taxable value of land and additions on the property. | Land | Improvement |
|---|---|---|---|---|
| 2025 | $98 | $277,960 | $98,137 | $179,823 |
| 2024 | $98 | $286,000 | $98,137 | $187,863 |
| 2023 | $98 | $320,091 | $98,137 | $221,954 |
| 2022 | $6,173 | $286,000 | $98,137 | $187,863 |
| 2021 | $5,731 | $245,911 | $87,623 | $158,288 |
| 2020 | $5,826 | $232,876 | $73,603 | $159,273 |
| 2019 | $6,129 | $234,788 | $73,603 | $161,185 |
| 2018 | $1,277 | $219,000 | $73,603 | $145,397 |
| 2017 | $5,366 | $207,083 | $73,603 | $133,480 |
| 2016 | $4,878 | $187,000 | $73,603 | $113,397 |
| 2015 | $1,536 | $201,000 | $73,603 | $127,397 |
| 2014 | $1,536 | $175,000 | $73,603 | $101,397 |
Source: Public Records
Map
Nearby Homes
- 6411 Redding Rd
- 8579 Sands Point Dr Unit 102
- 8543 Sands Point Dr
- 6602 Harbor Town Dr Unit 1207
- 6602 Harbor Town Dr Unit 1202
- 8435 Sands Point Dr
- 8223 Bellaire Blvd
- 8411 Sands Point Dr Unit 18
- 8360 Golf Green Cir
- 8359 Sands Point Dr Unit 218
- 6500 Harbor Town Dr Unit 3204
- 6500 Harbor Town Dr Unit 3408
- 6500 Harbor Town Dr Unit 2902
- 8314 Edgemoor Dr
- 8275 Sands Point Dr Unit 176
- 8527 Edgemoor Dr
- 8267 Sands Point Dr Unit 172
- 8257 Sands Point Dr Unit 167
- 8223 Golf Green Cir
- 8225 Sands Point Dr Unit 151
- 6531 Burning Tree Dr
- 6523 Burning Tree Dr
- 6603 Burning Tree Dr
- 6519 Burning Tree Dr
- 8503 Hornwood Dr
- 6607 Burning Tree Dr
- 8506 Clarewood Dr
- 6515 Burning Tree Dr
- 8503 Clarewood Dr
- 8507 Hornwood Dr
- 6611 Burning Tree Dr
- 8510 Clarewood Dr
- 8507 Clarewood Dr
- 6511 Burning Tree Dr
- 8502 Hornwood Dr
- 8511 Hornwood Dr
- 8502 De Moss Dr
- 8506 Hornwood Dr
- 8511 Clarewood Dr
- 6615 Burning Tree Dr