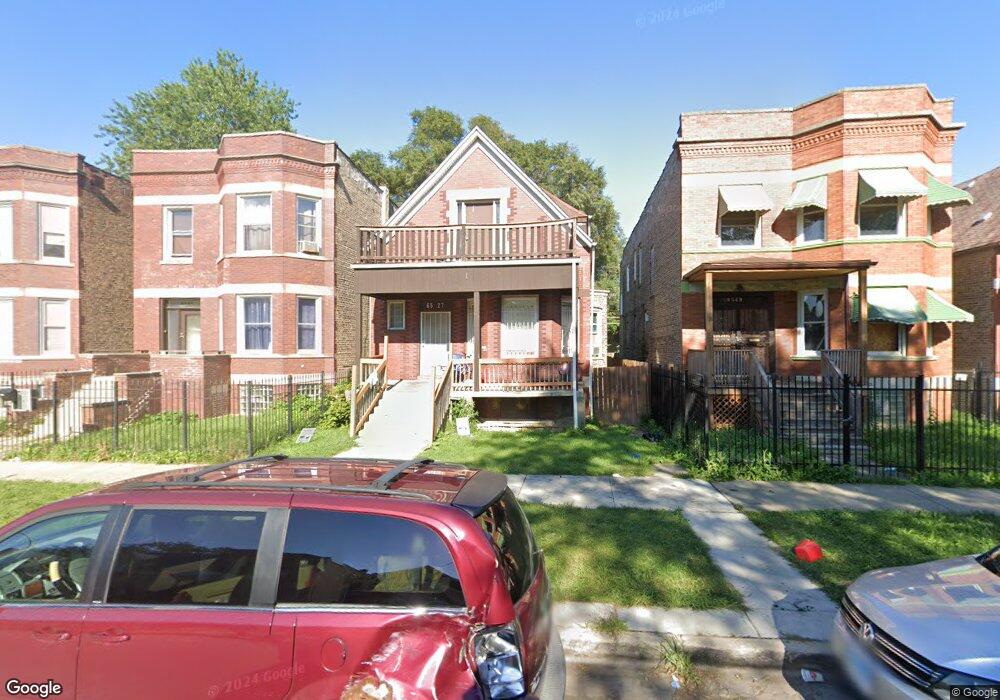
6527 S Hermitage Ave Chicago, IL 60636
Englewood NeighborhoodEstimated Value: $74,018 - $257,000
5
Beds
2
Baths
1,200
Sq Ft
$143/Sq Ft
Est. Value
About This Home
This home is located at 6527 S Hermitage Ave, Chicago, IL 60636 and is currently estimated at $171,005, approximately $142 per square foot. 6527 S Hermitage Ave is a home located in Cook County with nearby schools including O'Toole Elementary School, The Montessori School of Englewood Charter School, and Providence-Englewood Elementary Charter School.
Ownership History
Date
Name
Owned For
Owner Type
Purchase Details
Closed on
Mar 3, 2011
Sold by
Federal Home Loan Mortgage Corporation
Bought by
Thurman Clifton
Current Estimated Value
Purchase Details
Closed on
Jan 17, 2011
Sold by
Brantley
Bought by
Federal Home Loan Mortgage Corp
Purchase Details
Closed on
Jan 14, 2003
Sold by
Hff Corp Inc
Bought by
Brantley Rhonda
Home Financials for this Owner
Home Financials are based on the most recent Mortgage that was taken out on this home.
Original Mortgage
$162,000
Interest Rate
6.06%
Purchase Details
Closed on
Jul 23, 2002
Sold by
Household Finance Corp Iii
Bought by
Hff Corp Inc
Purchase Details
Closed on
Nov 28, 2001
Sold by
Wallace Willie B
Bought by
Household Finance Corp Iii
Purchase Details
Closed on
Aug 22, 1997
Sold by
Wallace Willie B
Bought by
Wallace Willie B
Create a Home Valuation Report for This Property
The Home Valuation Report is an in-depth analysis detailing your home's value as well as a comparison with similar homes in the area
Home Values in the Area
Average Home Value in this Area
Purchase History
| Date | Buyer | Sale Price | Title Company |
|---|---|---|---|
| Thurman Clifton | $9,000 | First American Title | |
| Federal Home Loan Mortgage Corp | -- | None Available | |
| Brantley Rhonda | $180,000 | Multiple | |
| Hff Corp Inc | $32,000 | First American Title | |
| Household Finance Corp Iii | -- | -- | |
| Wallace Willie B | -- | -- |
Source: Public Records
Mortgage History
| Date | Status | Borrower | Loan Amount |
|---|---|---|---|
| Previous Owner | Brantley Rhonda | $162,000 |
Source: Public Records
Tax History Compared to Growth
Tax History
| Year | Tax Paid | Tax Assessment Tax Assessment Total Assessment is a certain percentage of the fair market value that is determined by local assessors to be the total taxable value of land and additions on the property. | Land | Improvement |
|---|---|---|---|---|
| 2024 | $422 | $5,400 | $1,107 | $4,293 |
| 2023 | $411 | $2,000 | $1,492 | $508 |
| 2022 | $411 | $2,000 | $1,492 | $508 |
| 2021 | $402 | $1,998 | $1,490 | $508 |
| 2020 | $1,291 | $5,797 | $2,398 | $3,399 |
| 2019 | $1,309 | $6,514 | $2,398 | $4,116 |
| 2018 | $1,287 | $6,514 | $2,398 | $4,116 |
| 2017 | $1,564 | $7,265 | $2,214 | $5,051 |
| 2016 | $1,455 | $7,265 | $2,214 | $5,051 |
| 2015 | $1,331 | $7,265 | $2,214 | $5,051 |
| 2014 | $1,159 | $6,245 | $2,029 | $4,216 |
| 2013 | $1,136 | $6,245 | $2,029 | $4,216 |
Source: Public Records
Map
Nearby Homes
- 6522 S Paulina St
- 6544 S Paulina St
- 6541 S Hermitage Ave
- 6522 S Marshfield Ave
- 6544 S Hermitage Ave
- 6442 S Paulina St
- 6444 S Hermitage Ave
- 5943 S Marshfield Ave
- 6455 S Marshfield Ave
- 6437 S Marshfield Ave
- 5954 S Ashland Ave
- 5535 S Ashland Ave
- 6407 S Paulina St
- 6627 S Marshfield Ave
- 6422 S Ashland Ave
- 6441 S Ashland Ave
- 1638 W Marquette Rd
- 6502 S Wolcott Ave
- 6540 S Laflin St
- 6546 S Laflin St
- 6529 S Hermitage Ave Unit 1
- 6525 S Hermitage Ave Unit 2
- 6525 S Hermitage Ave Unit 1
- 6525 S Hermitage Ave
- 6531 S Hermitage Ave
- 6521 S Hermitage Ave Unit 1
- 6521 S Hermitage Ave
- 6517 S Hermitage Ave
- 6533 S Hermitage Ave
- 6539 S Hermitage Ave
- 6515 S Hermitage Ave Unit 2
- 6515 S Hermitage Ave
- 6524 S Paulina St
- 6528 S Paulina St
- 6522 S Paulina St Unit 2
- 6518 S Paulina St
- 6518 S Paulina St
- 6536 S Paulina St
- 6514 S Paulina St
- 6522 S Hermitage Ave