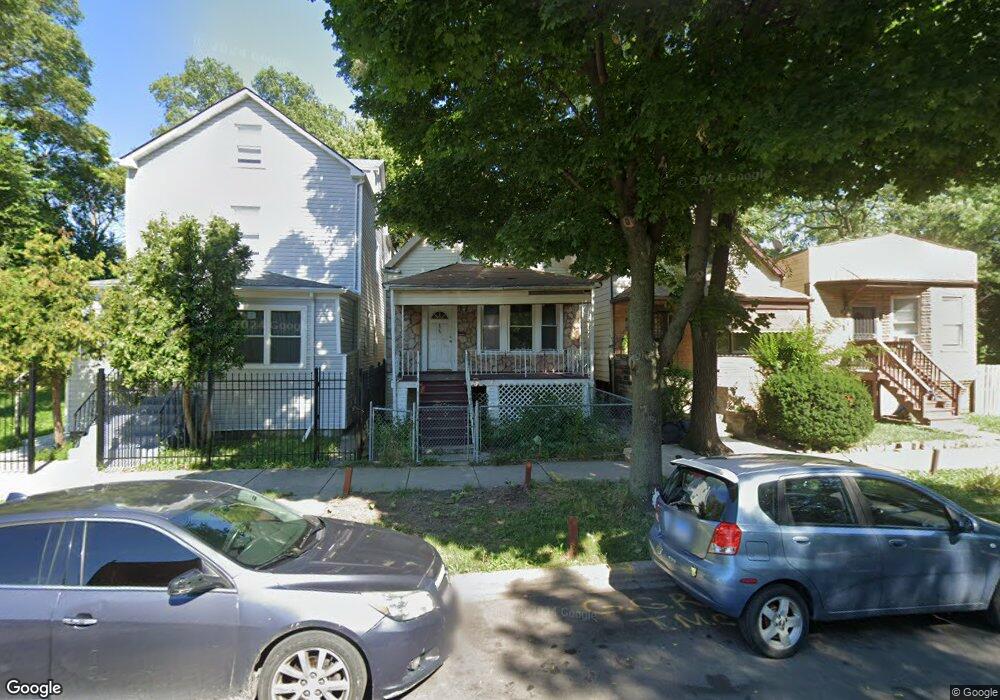
6527 S Seeley Ave Chicago, IL 60636
Englewood NeighborhoodEstimated Value: $66,095 - $123,000
3
Beds
1
Bath
882
Sq Ft
$122/Sq Ft
Est. Value
About This Home
This home is located at 6527 S Seeley Ave, Chicago, IL 60636 and is currently estimated at $107,274, approximately $121 per square foot. 6527 S Seeley Ave is a home located in Cook County with nearby schools including O'Toole Elementary School and Providence-Englewood Elementary Charter School.
Ownership History
Date
Name
Owned For
Owner Type
Purchase Details
Closed on
Mar 6, 2023
Sold by
Stokes Anthony
Bought by
Bello Dafnis Dirzo
Current Estimated Value
Purchase Details
Closed on
Jul 8, 2005
Sold by
Chavez Oscar
Bought by
Stokes Anthony
Home Financials for this Owner
Home Financials are based on the most recent Mortgage that was taken out on this home.
Original Mortgage
$74,400
Interest Rate
7.24%
Mortgage Type
Unknown
Purchase Details
Closed on
Jun 19, 2003
Sold by
Village Sites Inc
Bought by
Chavez Oscar
Home Financials for this Owner
Home Financials are based on the most recent Mortgage that was taken out on this home.
Original Mortgage
$48,750
Interest Rate
6%
Mortgage Type
Unknown
Purchase Details
Closed on
Jan 30, 1996
Sold by
Adele Mcclifton Kevin N and Adele Mcclifton
Bought by
The Chicago Trust Company
Create a Home Valuation Report for This Property
The Home Valuation Report is an in-depth analysis detailing your home's value as well as a comparison with similar homes in the area
Home Values in the Area
Average Home Value in this Area
Purchase History
| Date | Buyer | Sale Price | Title Company |
|---|---|---|---|
| Bello Dafnis Dirzo | $40,000 | None Listed On Document | |
| Stokes Anthony | $93,000 | Stewart Title Of Illinois | |
| Chavez Oscar | $65,000 | -- | |
| The Chicago Trust Company | -- | -- |
Source: Public Records
Mortgage History
| Date | Status | Borrower | Loan Amount |
|---|---|---|---|
| Previous Owner | Stokes Anthony | $74,400 | |
| Previous Owner | Chavez Oscar | $48,750 |
Source: Public Records
Tax History Compared to Growth
Tax History
| Year | Tax Paid | Tax Assessment Tax Assessment Total Assessment is a certain percentage of the fair market value that is determined by local assessors to be the total taxable value of land and additions on the property. | Land | Improvement |
|---|---|---|---|---|
| 2024 | $527 | $5,800 | $900 | $4,900 |
| 2023 | $514 | $2,500 | $1,549 | $951 |
| 2022 | $514 | $2,500 | $1,549 | $951 |
| 2021 | $503 | $2,499 | $1,548 | $951 |
| 2020 | $1,421 | $6,378 | $1,950 | $4,428 |
| 2019 | $1,440 | $7,167 | $1,950 | $5,217 |
| 2018 | $1,416 | $7,167 | $1,950 | $5,217 |
| 2017 | $1,936 | $8,991 | $1,800 | $7,191 |
| 2016 | $1,801 | $8,991 | $1,800 | $7,191 |
| 2015 | $1,648 | $8,991 | $1,800 | $7,191 |
| 2014 | $1,471 | $7,927 | $1,650 | $6,277 |
| 2013 | $1,442 | $7,927 | $1,650 | $6,277 |
Source: Public Records
Map
Nearby Homes
- 6518 S Damen Ave
- 6543 S Damen Ave
- 6454 S Winchester Ave
- 6430 S Seeley Ave
- 6545 S Hamilton Ave
- 6423 S Hoyne Ave
- 6502 S Wolcott Ave
- 6634 S Winchester Ave
- 6427 S Winchester Ave
- 6629 S Hamilton Ave
- 6607 S Winchester Ave
- 6151 S Damen Ave
- 6642 S Wolcott Ave
- 5755 S Wolcott Ave
- 2047 W 67th Place
- 6608 S Bell Ave
- 6544 S Hermitage Ave
- 6444 S Hermitage Ave
- 6448 S Oakley Ave
- 6716 S Bell Ave
- 6529 S Seeley Ave
- 6523 S Seeley Ave
- 6531 S Seeley Ave
- 6519 S Seeley Ave
- 6533 S Seeley Ave Unit 2
- 6533 S Seeley Ave
- 6535 S Seeley Ave
- 6535 S Seeley Ave
- 6539 S Seeley Ave
- 6515 S Seeley Ave
- 6515 S Seeley Ave
- 6526 S Damen Ave
- 6524 S Damen Ave
- 6528 S Damen Ave
- 6536 S Damen Ave
- 6520 S Damen Ave
- 6511 S Seeley Ave
- 6534 S Damen Ave
- 6530 S Damen Ave
- 6530 S Damen Ave