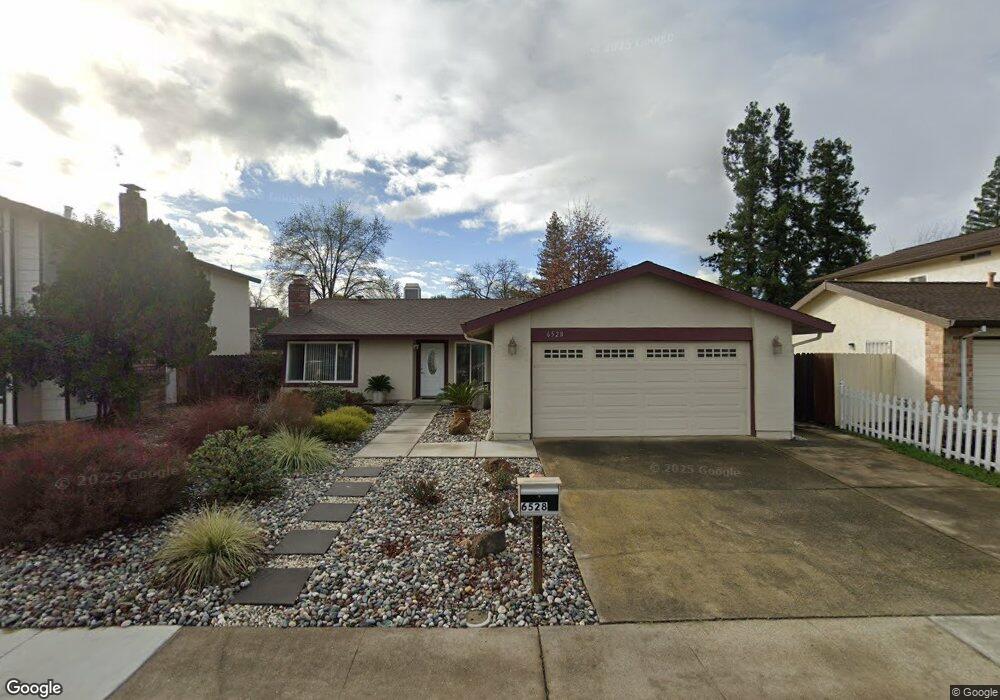
6528 Creekmont Way Citrus Heights, CA 95621
Estimated Value: $175,000 - $503,000
4
Beds
2
Baths
1,493
Sq Ft
$276/Sq Ft
Est. Value
About This Home
This home is located at 6528 Creekmont Way, Citrus Heights, CA 95621 and is currently estimated at $411,945, approximately $275 per square foot. 6528 Creekmont Way is a home located in Sacramento County with nearby schools including Arlington Heights Elementary School, Sylvan Middle School, and Mesa Verde High School.
Ownership History
Date
Name
Owned For
Owner Type
Purchase Details
Closed on
Oct 19, 2016
Sold by
Roberts Roy R and Roberts Vanette Elizabeth
Bought by
Roberts Roy R and Roberts Vanette E
Current Estimated Value
Purchase Details
Closed on
Dec 16, 2011
Sold by
Roberts Roy R
Bought by
Roberts Roy R and Roberts Vanette Elizabeth
Purchase Details
Closed on
Oct 14, 2011
Sold by
Hooper Rachel M
Bought by
Wiese Investments Inc
Purchase Details
Closed on
Apr 25, 2006
Sold by
Hooper Rachel M
Bought by
Hooper James W and Hooper Rachel M
Home Financials for this Owner
Home Financials are based on the most recent Mortgage that was taken out on this home.
Original Mortgage
$51,000
Interest Rate
6.35%
Mortgage Type
Stand Alone Second
Purchase Details
Closed on
Apr 6, 2006
Sold by
Hooper James
Bought by
Hooper Rachel M
Home Financials for this Owner
Home Financials are based on the most recent Mortgage that was taken out on this home.
Original Mortgage
$51,000
Interest Rate
6.35%
Mortgage Type
Stand Alone Second
Purchase Details
Closed on
Apr 5, 2006
Sold by
Watkins Joseph W and Watkins Marla D
Bought by
Hooper Rachel M
Home Financials for this Owner
Home Financials are based on the most recent Mortgage that was taken out on this home.
Original Mortgage
$51,000
Interest Rate
6.35%
Mortgage Type
Stand Alone Second
Purchase Details
Closed on
Apr 27, 2004
Sold by
Watkins Joseph W and Watkins Marla D
Bought by
Watkins Joseph W and Watkins Marla D
Purchase Details
Closed on
Feb 25, 2004
Sold by
Watkins Joseph W and Watkins Maria D
Bought by
Watkins Joseph W
Home Financials for this Owner
Home Financials are based on the most recent Mortgage that was taken out on this home.
Original Mortgage
$168,000
Interest Rate
1.62%
Mortgage Type
New Conventional
Purchase Details
Closed on
Sep 25, 2002
Sold by
Watkins Joseph W
Bought by
Watkins Joseph W and Watkins Marla D
Home Financials for this Owner
Home Financials are based on the most recent Mortgage that was taken out on this home.
Original Mortgage
$166,400
Interest Rate
6.16%
Purchase Details
Closed on
Aug 23, 2001
Sold by
Meese George E and Meese Bella L
Bought by
Watkins Joseph W
Home Financials for this Owner
Home Financials are based on the most recent Mortgage that was taken out on this home.
Original Mortgage
$166,642
Interest Rate
7.09%
Mortgage Type
FHA
Create a Home Valuation Report for This Property
The Home Valuation Report is an in-depth analysis detailing your home's value as well as a comparison with similar homes in the area
Home Values in the Area
Average Home Value in this Area
Purchase History
| Date | Buyer | Sale Price | Title Company |
|---|---|---|---|
| Roberts Roy R | -- | None Available | |
| Roberts Roy R | -- | None Available | |
| Roberts Roy R | $164,000 | Fidelity National Title Co | |
| Wiese Investments Inc | $126,100 | None Available | |
| Hooper James W | -- | None Available | |
| Hooper Rachel M | -- | Chicago Title Co | |
| Hooper Rachel M | $340,000 | Chicago Title Co | |
| Watkins Joseph W | -- | -- | |
| Watkins Joseph W | -- | Old Republic Title Company | |
| Watkins Joseph W | -- | Old Republic Title Company | |
| Watkins Joseph W | $169,000 | Fidelity National Title Co |
Source: Public Records
Mortgage History
| Date | Status | Borrower | Loan Amount |
|---|---|---|---|
| Previous Owner | Hooper Rachel M | $51,000 | |
| Previous Owner | Hooper Rachel M | $272,000 | |
| Previous Owner | Watkins Joseph W | $168,000 | |
| Previous Owner | Watkins Joseph W | $166,400 | |
| Previous Owner | Watkins Joseph W | $166,642 |
Source: Public Records
Tax History Compared to Growth
Tax History
| Year | Tax Paid | Tax Assessment Tax Assessment Total Assessment is a certain percentage of the fair market value that is determined by local assessors to be the total taxable value of land and additions on the property. | Land | Improvement |
|---|---|---|---|---|
| 2025 | $2,366 | $205,979 | $62,796 | $143,183 |
| 2024 | $2,366 | $201,941 | $61,565 | $140,376 |
| 2023 | $2,304 | $197,982 | $60,358 | $137,624 |
| 2022 | $2,291 | $194,101 | $59,175 | $134,926 |
| 2021 | $2,252 | $190,296 | $58,015 | $132,281 |
| 2020 | $2,209 | $188,346 | $57,421 | $130,925 |
| 2019 | $2,163 | $184,654 | $56,296 | $128,358 |
| 2018 | $2,138 | $181,035 | $55,193 | $125,842 |
| 2017 | $2,116 | $177,486 | $54,111 | $123,375 |
| 2016 | $1,976 | $174,006 | $53,050 | $120,956 |
| 2015 | $1,940 | $171,394 | $52,254 | $119,140 |
| 2014 | $1,899 | $168,038 | $51,231 | $116,807 |
Source: Public Records
Map
Nearby Homes
- 7101 van Maren Ln
- 7105 Ansley Ct
- 7032 Sunburst Way
- 6336 Twin Wood Way
- 7409 Circlet Way
- 6508 Skylane Dr
- 6829 Kittery Ave
- 6937 Grand Tree Ln
- 6912 van Maren Ln
- 6501 Navion Dr
- 7006 Enright Dr
- 7136 Baranga Dr
- 6936 Winlock Ave
- 6862 Westchester Way
- 7058 Enright Dr
- 6608 Trailride Way
- 6721 Navion Dr
- 7116 Grenola Way
- 6923 Daisy Ln
- 7215 Coronet Ct
- 6532 Creekmont Way
- 6524 Creekmont Way
- 6619 Oak Branch Ct
- 6615 Oak Branch Ct
- 6520 Creekmont Way
- 6536 Creekmont Way
- 6627 Oak Branch Ct
- 6611 Oak Branch Ct
- 6529 Creekmont Way
- 6525 Creekmont Way
- 6549 Creekmont Way
- 6607 Oak Branch Ct
- 6521 Creekmont Way
- 6516 Creekmont Way
- 6540 Creekmont Way
- 7140 Twin Brook Ct
- 6517 Creekmont Way
- 7136 Twin Brook Ct
- 6601 Creekmont Way
- 6512 Creekmont Way