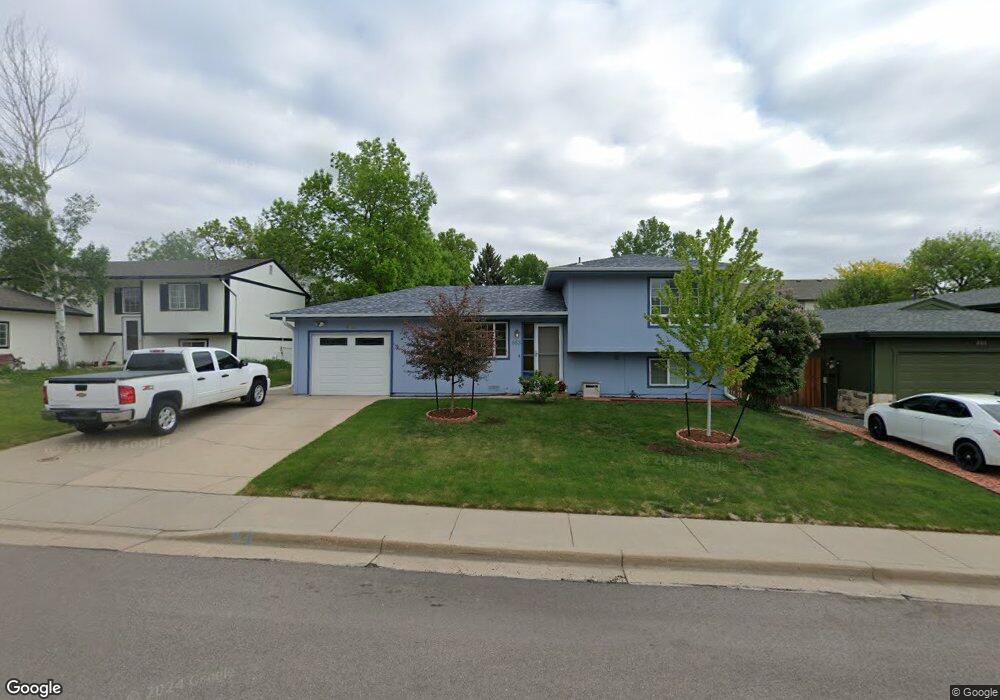
653 19th St SW Loveland, CO 80537
Estimated Value: $379,848 - $421,000
3
Beds
2
Baths
1,269
Sq Ft
$319/Sq Ft
Est. Value
About This Home
This home is located at 653 19th St SW, Loveland, CO 80537 and is currently estimated at $405,212, approximately $319 per square foot. 653 19th St SW is a home located in Larimer County with nearby schools including B. F. Kitchen Elementary School, Bill Reed Middle School, and Thompson Valley High School.
Ownership History
Date
Name
Owned For
Owner Type
Purchase Details
Closed on
Jul 26, 2002
Sold by
Moore Forest M and Moore Virginia D
Bought by
Werner Kenneth H and Werner Barbara J
Current Estimated Value
Home Financials for this Owner
Home Financials are based on the most recent Mortgage that was taken out on this home.
Original Mortgage
$83,000
Outstanding Balance
$35,473
Interest Rate
6.69%
Estimated Equity
$369,739
Purchase Details
Closed on
Jun 23, 2000
Sold by
Mann Steven A
Bought by
Moore Forest M and Moore Virginia D
Home Financials for this Owner
Home Financials are based on the most recent Mortgage that was taken out on this home.
Original Mortgage
$101,900
Interest Rate
8.66%
Purchase Details
Closed on
Jul 9, 1997
Sold by
Mann Steven Arnold
Bought by
Mann Steven A and Mann Debra L
Home Financials for this Owner
Home Financials are based on the most recent Mortgage that was taken out on this home.
Original Mortgage
$58,600
Interest Rate
7.85%
Create a Home Valuation Report for This Property
The Home Valuation Report is an in-depth analysis detailing your home's value as well as a comparison with similar homes in the area
Home Values in the Area
Average Home Value in this Area
Purchase History
| Date | Buyer | Sale Price | Title Company |
|---|---|---|---|
| Werner Kenneth H | $163,000 | -- | |
| Moore Forest M | $131,900 | -- | |
| Mann Steven A | -- | -- |
Source: Public Records
Mortgage History
| Date | Status | Borrower | Loan Amount |
|---|---|---|---|
| Open | Werner Kenneth H | $83,000 | |
| Previous Owner | Moore Forest M | $101,900 | |
| Previous Owner | Mann Steven A | $58,600 |
Source: Public Records
Tax History Compared to Growth
Tax History
| Year | Tax Paid | Tax Assessment Tax Assessment Total Assessment is a certain percentage of the fair market value that is determined by local assessors to be the total taxable value of land and additions on the property. | Land | Improvement |
|---|---|---|---|---|
| 2025 | $1,236 | $25,869 | $1,367 | $24,502 |
| 2024 | $1,192 | $25,869 | $1,367 | $24,502 |
| 2022 | $1,037 | $19,988 | $1,418 | $18,570 |
| 2021 | $1,066 | $20,564 | $1,459 | $19,105 |
| 2020 | $935 | $18,905 | $1,459 | $17,446 |
| 2019 | $919 | $18,905 | $1,459 | $17,446 |
| 2018 | $1,288 | $15,653 | $1,469 | $14,184 |
| 2017 | $1,109 | $15,653 | $1,469 | $14,184 |
| 2016 | $1,016 | $13,851 | $1,624 | $12,227 |
| 2015 | $1,008 | $13,850 | $1,620 | $12,230 |
| 2014 | $829 | $11,030 | $1,620 | $9,410 |
Source: Public Records
Map
Nearby Homes
- 1918 Cindy Ct
- 1739 S California Ave
- 0 SW 14th St Unit 949960
- 707 22nd St SW
- 1687 Valency Dr
- 1679 Valency Dr
- 1673 Valency Dr
- 913 21st St SW
- 2240 Delia Ct
- 2318 S Colorado Ave
- 2139 Donna Ct
- 220 12th St SW Unit 125
- 1902 Diana Dr
- 1101 20th St SW
- 527 24th Place SW
- 1191 23rd St SW
- 2120 S Taft Ave
- 214 Sierra Vista Dr
- 1417 Glenda Ct
- 2150 Derby Hill Dr