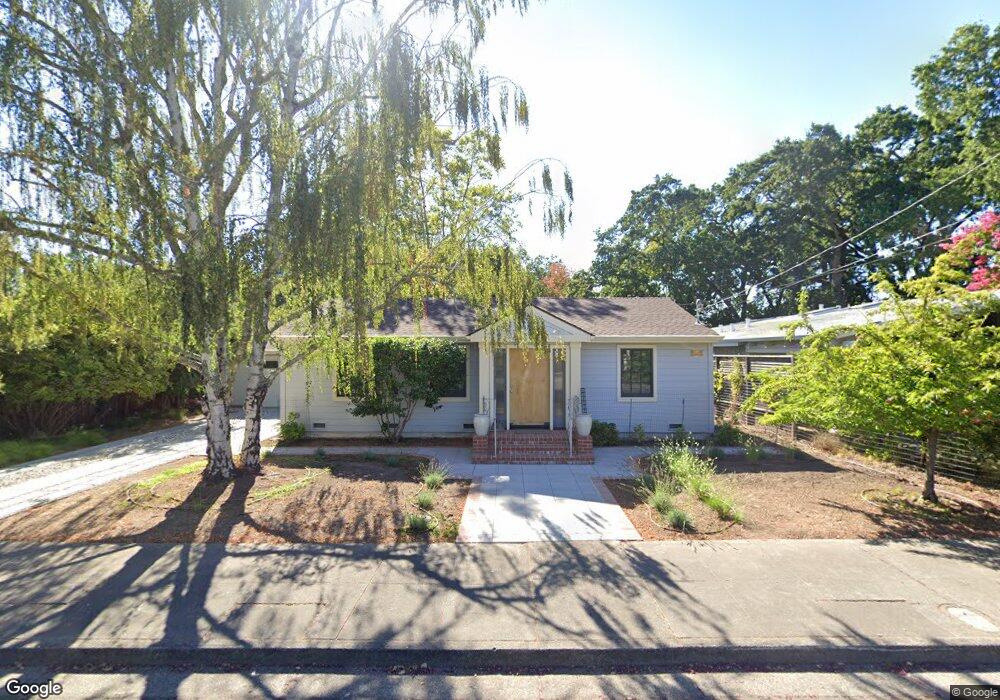
653 Austin Ave Sonoma, CA 95476
Estimated Value: $942,000 - $1,364,000
2
Beds
2
Baths
1,229
Sq Ft
$917/Sq Ft
Est. Value
About This Home
This home is located at 653 Austin Ave, Sonoma, CA 95476 and is currently estimated at $1,126,773, approximately $916 per square foot. 653 Austin Ave is a home located in Sonoma County with nearby schools including Prestwood Elementary School, Adele Harrison Middle School, and Creekside High School.
Ownership History
Date
Name
Owned For
Owner Type
Purchase Details
Closed on
Dec 12, 2011
Sold by
Ryan Joan Agnes
Bought by
Ryan Joan Agnes and Osullivan John Gerard
Current Estimated Value
Purchase Details
Closed on
Oct 31, 2011
Sold by
Ryan Elish Marie and Ryan Joan Agnes
Bought by
Ryan Joan Agnes
Purchase Details
Closed on
Mar 28, 2007
Sold by
Ryan Edmond and Ryan Edmond
Bought by
Ryan Edmond and Ryan Edmond
Purchase Details
Closed on
Oct 17, 1996
Sold by
Ryan Edmond and Ryan Josephine
Bought by
Ryan Edmond and Ryan Josephine
Create a Home Valuation Report for This Property
The Home Valuation Report is an in-depth analysis detailing your home's value as well as a comparison with similar homes in the area
Home Values in the Area
Average Home Value in this Area
Purchase History
| Date | Buyer | Sale Price | Title Company |
|---|---|---|---|
| Ryan Joan Agnes | -- | None Available | |
| Ryan Joan Agnes | -- | None Available | |
| Ryan Edmond | -- | None Available | |
| Ryan Edmond | -- | -- |
Source: Public Records
Tax History
| Year | Tax Paid | Tax Assessment Tax Assessment Total Assessment is a certain percentage of the fair market value that is determined by local assessors to be the total taxable value of land and additions on the property. | Land | Improvement |
|---|---|---|---|---|
| 2025 | $3,569 | $684,326 | $66,601 | $617,725 |
| 2024 | $3,569 | $200,909 | $65,296 | $135,613 |
| 2023 | $3,569 | $196,970 | $64,016 | $132,954 |
| 2022 | $3,470 | $193,109 | $62,761 | $130,348 |
| 2021 | $3,297 | $189,324 | $61,531 | $127,793 |
| 2020 | $3,267 | $187,384 | $60,901 | $126,483 |
| 2019 | $3,192 | $183,710 | $59,707 | $124,003 |
| 2018 | $3,273 | $180,109 | $58,537 | $121,572 |
| 2017 | $3,935 | $176,579 | $57,390 | $119,189 |
| 2016 | $2,927 | $173,117 | $56,265 | $116,852 |
| 2015 | $2,956 | $170,517 | $55,420 | $115,097 |
| 2014 | $3,064 | $167,178 | $54,335 | $112,843 |
Source: Public Records
Map
Nearby Homes
Your Personal Tour Guide
Ask me questions while you tour the home.