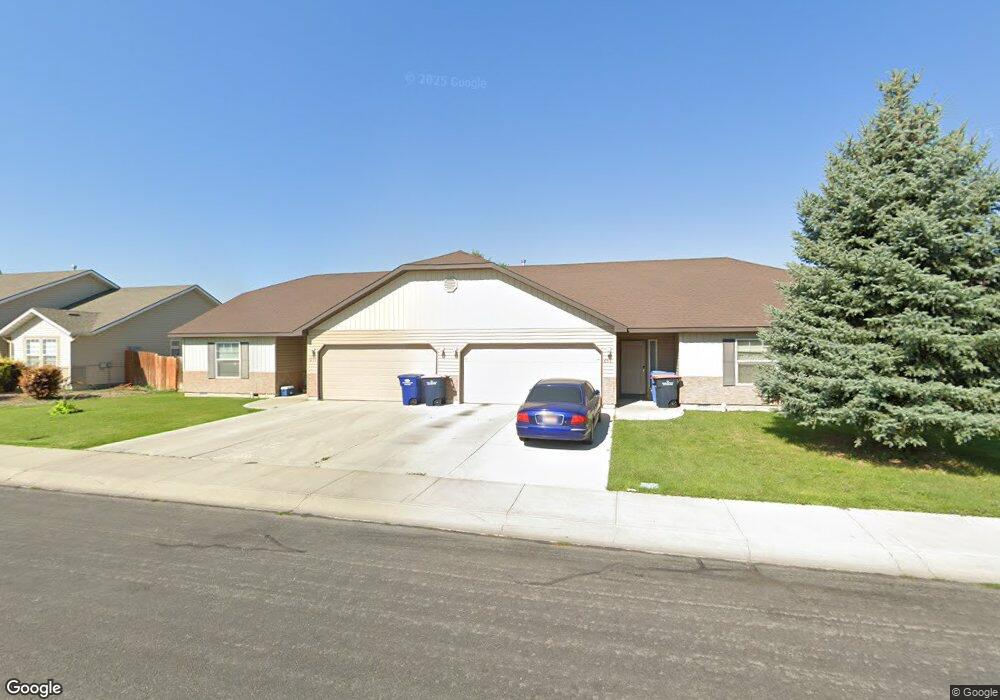
653 Beta St Twin Falls, ID 83301
Estimated Value: $486,000 - $638,000
6
Beds
4
Baths
2,540
Sq Ft
$210/Sq Ft
Est. Value
About This Home
This home is located at 653 Beta St, Twin Falls, ID 83301 and is currently estimated at $533,422, approximately $210 per square foot. 653 Beta St is a home located in Twin Falls County with nearby schools including I.B. Perrine Elementary School, Robert Stuart Junior High School, and Canyon Ridge High School.
Ownership History
Date
Name
Owned For
Owner Type
Purchase Details
Closed on
Oct 25, 2022
Sold by
Hardy Keith
Bought by
L And K Holdings Iii Llc
Current Estimated Value
Purchase Details
Closed on
Oct 25, 2021
Sold by
Proppoynt Beta 653-655 Llc
Bought by
Hardy Keith R and Hardy Lani D
Purchase Details
Closed on
Jan 5, 2021
Sold by
Lvh Beta Llc
Bought by
Proppoynt Beta 653 655 Llc
Purchase Details
Closed on
Dec 29, 2015
Sold by
Lierman Ryan Lee
Bought by
Lvh Beta Llc
Purchase Details
Closed on
Sep 11, 2015
Sold by
Wright Dale M and Wright Diane T
Bought by
Lierman Ryan Lee
Home Financials for this Owner
Home Financials are based on the most recent Mortgage that was taken out on this home.
Original Mortgage
$157,500
Interest Rate
3.91%
Mortgage Type
New Conventional
Create a Home Valuation Report for This Property
The Home Valuation Report is an in-depth analysis detailing your home's value as well as a comparison with similar homes in the area
Purchase History
| Date | Buyer | Sale Price | Title Company |
|---|---|---|---|
| L And K Holdings Iii Llc | -- | -- | |
| Hardy Keith R | -- | Title One | |
| Proppoynt Beta 653 655 Llc | -- | Accommodation | |
| Lvh Beta Llc | -- | Titleone Twin Falls | |
| Lierman Ryan Lee | -- | Titleone |
Source: Public Records
Mortgage History
| Date | Status | Borrower | Loan Amount |
|---|---|---|---|
| Previous Owner | Lierman Ryan Lee | $157,500 |
Source: Public Records
Tax History
| Year | Tax Paid | Tax Assessment Tax Assessment Total Assessment is a certain percentage of the fair market value that is determined by local assessors to be the total taxable value of land and additions on the property. | Land | Improvement |
|---|---|---|---|---|
| 2025 | $4,593 | $427,807 | $77,194 | $350,613 |
| 2024 | $4,641 | $432,190 | $77,194 | $354,996 |
| 2023 | $4,749 | $454,105 | $77,194 | $376,911 |
| 2022 | $5,364 | $468,466 | $67,252 | $401,214 |
| 2021 | $5,393 | $358,194 | $61,851 | $296,343 |
| 2020 | $4,664 | $305,749 | $57,143 | $248,606 |
| 2019 | $4,558 | $255,127 | $41,494 | $213,633 |
| 2018 | $4,651 | $248,375 | $30,692 | $217,683 |
| 2017 | $4,237 | $226,001 | $30,692 | $195,309 |
| 2016 | $3,948 | $196,985 | $0 | $0 |
| 2015 | $3,842 | $196,985 | $30,692 | $166,293 |
| 2012 | -- | $180,497 | $0 | $0 |
Source: Public Records
Map
Nearby Homes
- 733 Beta Cir
- 743 Lawrence Ave
- 965 Bosero Way
- 964 Borah Ave W
- 973 Kenbrook Loop
- 458 Rose St N
- 947 Americana Cir
- 509-523 Rose St N
- 1005 Kenbrook Loop
- 489 Borah Ave W
- 544 Falls Ave W
- 403 Filer Ave W
- 905 Birchton Loop
- 893 Shadowleaf Ave
- 720 Shadowleaf Ave
- 657 Creekside Way
- 827 Mossview
- 280 Carney St
- 1143 Langford Way
- 551 Park Meadows Cir
Your Personal Tour Guide
Ask me questions while you tour the home.