Estimated Value: $327,841 - $384,000
3
Beds
3
Baths
2,220
Sq Ft
$157/Sq Ft
Est. Value
About This Home
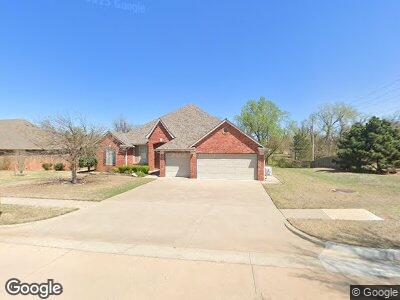
This home is located at 653 Branch Line Rd, Yukon, OK 73099 and is currently estimated at $348,210, approximately $156 per square foot. 653 Branch Line Rd is a home located in Canadian County with nearby schools including Banner School and St. John Nepomuk Catholic School.
Ownership History
Date
Name
Owned For
Owner Type
Purchase Details
Closed on
Jun 7, 2024
Sold by
Kenneth And Cara Goodwin Living Trust and Goodwin Kenneth Paul
Bought by
Kenneth Goodwin Living Trust and Goodwin
Current Estimated Value
Purchase Details
Closed on
Aug 16, 2021
Sold by
Goodwin Kenneth Paul and Goodwin Cara Lea
Bought by
Goodwin Kenneth Paul and Goodwin Cara L
Purchase Details
Closed on
Aug 26, 2016
Sold by
Odb Investors Llc
Bought by
Jah Interprises Inc
Purchase Details
Closed on
Jun 30, 2008
Sold by
Greg Smith Homes Llc
Bought by
Goodwin Ii Kenneth Paul and Goodwin Cara
Home Financials for this Owner
Home Financials are based on the most recent Mortgage that was taken out on this home.
Original Mortgage
$160,000
Interest Rate
6.05%
Mortgage Type
New Conventional
Purchase Details
Closed on
Jan 31, 2008
Sold by
Lone Oak Ridge Llc
Bought by
Creg Smith Homes Llc
Home Financials for this Owner
Home Financials are based on the most recent Mortgage that was taken out on this home.
Original Mortgage
$207,000
Interest Rate
6.07%
Create a Home Valuation Report for This Property
The Home Valuation Report is an in-depth analysis detailing your home's value as well as a comparison with similar homes in the area
Home Values in the Area
Average Home Value in this Area
Purchase History
| Date | Buyer | Sale Price | Title Company |
|---|---|---|---|
| Kenneth Goodwin Living Trust | -- | None Listed On Document | |
| Goodwin Kenneth Paul | -- | None Available | |
| Jah Interprises Inc | $40,000 | None Available |
Source: Public Records
Mortgage History
| Date | Status | Borrower | Loan Amount |
|---|---|---|---|
| Previous Owner | Goodwin Ii Kenneth Paul | $149,800 |
Source: Public Records
Tax History Compared to Growth
Tax History
| Year | Tax Paid | Tax Assessment Tax Assessment Total Assessment is a certain percentage of the fair market value that is determined by local assessors to be the total taxable value of land and additions on the property. | Land | Improvement |
|---|---|---|---|---|
| 2024 | $2,370 | $31,930 | $5,280 | $26,650 |
| 2023 | $2,370 | $31,000 | $5,280 | $25,720 |
| 2022 | $2,331 | $30,097 | $5,280 | $24,817 |
| 2021 | $2,279 | $29,221 | $5,280 | $23,941 |
| 2020 | $2,193 | $28,370 | $5,280 | $23,090 |
| 2019 | $2,146 | $27,543 | $5,280 | $22,263 |
| 2018 | $2,118 | $26,741 | $5,280 | $21,461 |
| 2017 | $2,141 | $26,741 | $5,280 | $21,461 |
| 2016 | $2,199 | $27,975 | $5,280 | $22,695 |
| 2015 | $2,076 | $27,330 | $5,340 | $21,990 |
| 2014 | $2,076 | $26,900 | $5,340 | $21,560 |
Source: Public Records
Map
Nearby Homes
- 1912 Hobo St
- 505 Switch Rd
- 3424 Mount Nebo Dr
- 624 Frisco Ridge Rd
- 1059 Elm Ave
- 421 S 9th St
- 10716 Coeur Ct
- 11625 NW 104th St
- 11717 NW 104th St
- 713 Kingston Dr
- 621 Cedar Ave
- 9028 NW 149th Terrace
- 9024 NW 149th Terrace
- 612 Oak Ave
- 1313 Kingston Dr
- 1308 Holly Ave
- 1110 Kouba Dr
- 3609 Sawtooth Ridge Dr
- 10513 NW 33rd Place
- 10517 NW 33rd Place
- 653 Branch Line Rd
- 649 Branch Line Rd
- 1800 Hobo
- 695 Kingsgate Rd
- 641 Branch Line Rd
- 1804 Hobo St
- 1801 Hobo St
- 1801 Kingsgate Terrace
- 699 Kingsgate Rd
- 608 Winding Creek Rd
- 1808 Hobo St
- 1805 Kingsgate Terrace
- 1805 Kingsgate Terrace
- 1809 Hobo St
- 1800 Grainer St
- 612 Winding Creek Rd
- 633 Branch Line Rd
- 1812 Hobo St
- 1813 Kingsgate Terrace
- 700 Kingsgate Rd