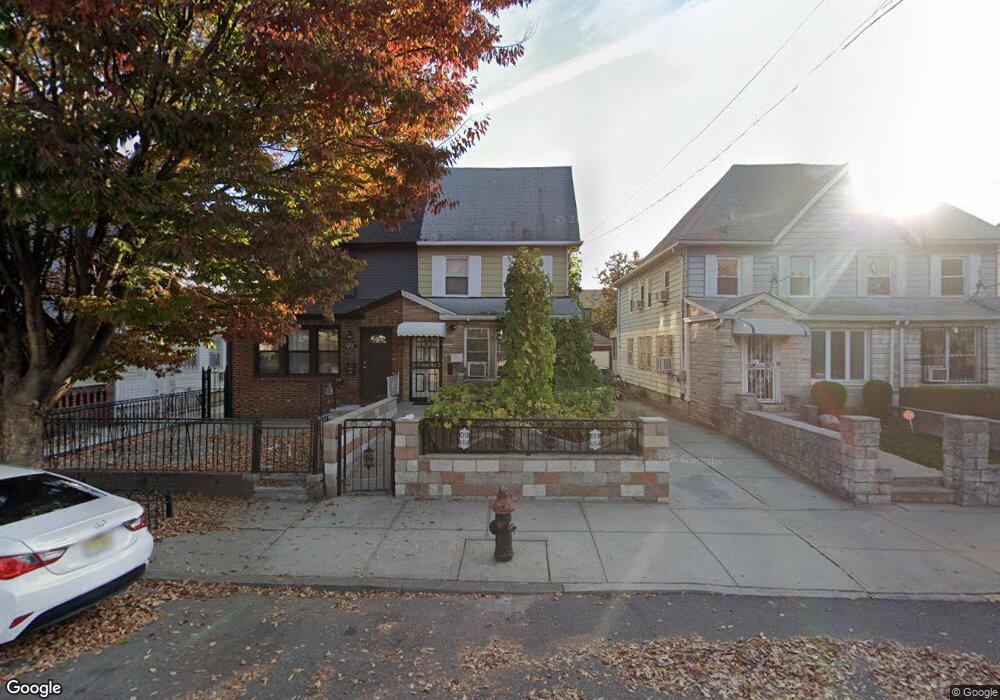
653 E 53rd St Unit 2 Brooklyn, NY 11203
East Flatbush NeighborhoodEstimated Value: $652,000 - $725,000
2
Beds
1
Bath
1,344
Sq Ft
$517/Sq Ft
Est. Value
About This Home
This home is located at 653 E 53rd St Unit 2, Brooklyn, NY 11203 and is currently estimated at $694,622, approximately $516 per square foot. 653 E 53rd St Unit 2 is a home located in Kings County with nearby schools including Ps 244 Richard R Green, I.S. 285 Meyer Levin, and Ivy Hill Preparatory Charter School.
Ownership History
Date
Name
Owned For
Owner Type
Purchase Details
Closed on
Jul 1, 2022
Sold by
Josephine Blaizes Trustee
Bought by
Nabi Mohammed Nur and Nahar Mussammat N
Current Estimated Value
Home Financials for this Owner
Home Financials are based on the most recent Mortgage that was taken out on this home.
Original Mortgage
$508,000
Outstanding Balance
$483,885
Interest Rate
5.23%
Mortgage Type
Purchase Money Mortgage
Estimated Equity
$210,737
Purchase Details
Closed on
Feb 20, 2019
Sold by
Peoples Mildred
Bought by
Josephine P Blaizes Trustee and Mildred Peoples Irrevocable Grantor Trus
Create a Home Valuation Report for This Property
The Home Valuation Report is an in-depth analysis detailing your home's value as well as a comparison with similar homes in the area
Home Values in the Area
Average Home Value in this Area
Purchase History
| Date | Buyer | Sale Price | Title Company |
|---|---|---|---|
| Nabi Mohammed Nur | $635,000 | -- | |
| Josephine P Blaizes Trustee | -- | -- |
Source: Public Records
Mortgage History
| Date | Status | Borrower | Loan Amount |
|---|---|---|---|
| Open | Nabi Mohammed Nur | $508,000 |
Source: Public Records
Tax History
| Year | Tax Paid | Tax Assessment Tax Assessment Total Assessment is a certain percentage of the fair market value that is determined by local assessors to be the total taxable value of land and additions on the property. | Land | Improvement |
|---|---|---|---|---|
| 2025 | $5,973 | $47,040 | $12,900 | $34,140 |
| 2024 | $5,973 | $45,240 | $12,900 | $32,340 |
| 2023 | $5,699 | $40,200 | $12,900 | $27,300 |
| 2022 | $4,998 | $36,120 | $12,900 | $23,220 |
| 2021 | $5,275 | $35,640 | $12,900 | $22,740 |
| 2019 | $4,892 | $33,900 | $12,900 | $21,000 |
| 2018 | $4,469 | $23,383 | $9,327 | $14,056 |
| 2017 | $3,851 | $22,062 | $10,517 | $11,545 |
| 2016 | $1,584 | $22,062 | $10,635 | $11,427 |
| 2015 | $816 | $20,880 | $14,340 | $6,540 |
| 2014 | $816 | $20,654 | $12,625 | $8,029 |
Source: Public Records
Map
Nearby Homes
Your Personal Tour Guide
Ask me questions while you tour the home.