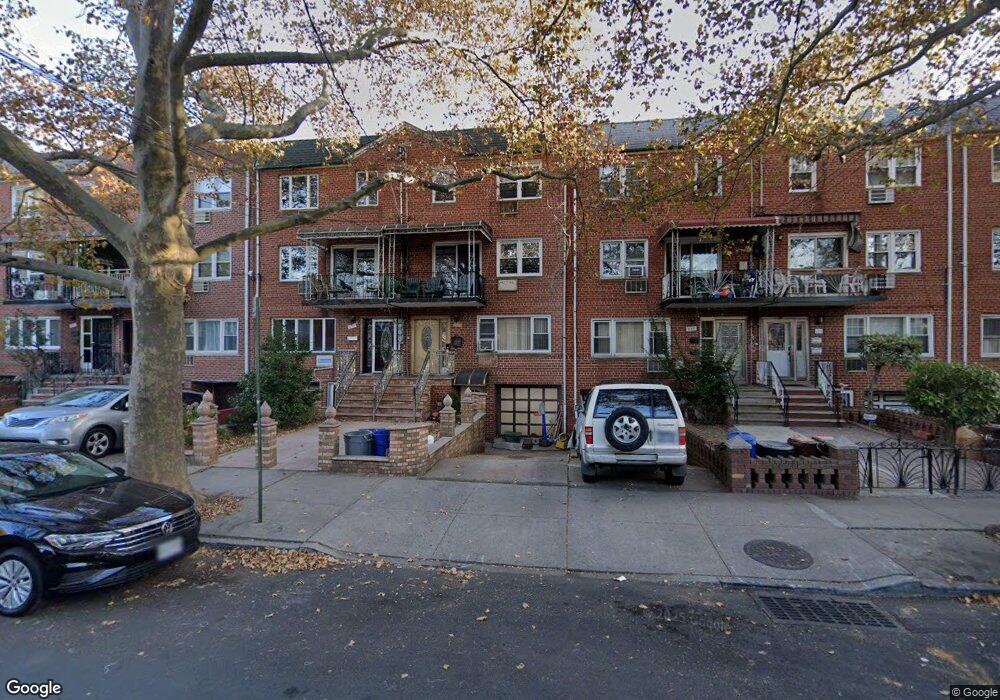
653 E 79th St Unit 2 Brooklyn, NY 11236
Canarsie NeighborhoodEstimated Value: $919,460 - $1,066,000
Studio
3
Baths
3,450
Sq Ft
$297/Sq Ft
Est. Value
About This Home
This home is located at 653 E 79th St Unit 2, Brooklyn, NY 11236 and is currently estimated at $1,024,615, approximately $296 per square foot. 653 E 79th St Unit 2 is a home located in Kings County with nearby schools including P.S. 276 Louis Marshall, Is 68 Isaac Bildersee, and Ivy Hill Preparatory Charter School.
Ownership History
Date
Name
Owned For
Owner Type
Purchase Details
Closed on
Mar 25, 2002
Sold by
Markland Melicia Hr and Markland Marlando Hr
Bought by
Markland Melicia
Current Estimated Value
Home Financials for this Owner
Home Financials are based on the most recent Mortgage that was taken out on this home.
Original Mortgage
$230,000
Interest Rate
6.55%
Mortgage Type
Purchase Money Mortgage
Purchase Details
Closed on
Apr 16, 1996
Sold by
Wilson Yvonne Jean and Wilson Yvonne
Bought by
Markland Dorrett V and Lindsay Dorothy
Home Financials for this Owner
Home Financials are based on the most recent Mortgage that was taken out on this home.
Original Mortgage
$220,500
Interest Rate
7.77%
Create a Home Valuation Report for This Property
The Home Valuation Report is an in-depth analysis detailing your home's value as well as a comparison with similar homes in the area
Home Values in the Area
Average Home Value in this Area
Purchase History
| Date | Buyer | Sale Price | Title Company |
|---|---|---|---|
| Markland Melicia | -- | -- | |
| Markland Dorrett V | $245,000 | -- |
Source: Public Records
Mortgage History
| Date | Status | Borrower | Loan Amount |
|---|---|---|---|
| Previous Owner | Markland Melicia | $230,000 | |
| Previous Owner | Markland Dorrett V | $220,500 |
Source: Public Records
Tax History
| Year | Tax Paid | Tax Assessment Tax Assessment Total Assessment is a certain percentage of the fair market value that is determined by local assessors to be the total taxable value of land and additions on the property. | Land | Improvement |
|---|---|---|---|---|
| 2025 | $8,894 | $66,840 | $10,140 | $56,700 |
| 2024 | $8,894 | $64,200 | $10,140 | $54,060 |
| 2023 | $8,974 | $66,840 | $10,560 | $56,280 |
| 2022 | $8,322 | $64,020 | $10,560 | $53,460 |
| 2021 | $8,725 | $49,440 | $10,560 | $38,880 |
| 2019 | $7,719 | $36,900 | $10,560 | $26,340 |
| 2018 | $7,507 | $36,824 | $9,461 | $27,363 |
| 2017 | $7,082 | $34,740 | $10,560 | $24,180 |
| 2016 | $7,545 | $37,742 | $10,494 | $27,248 |
| 2015 | $4,332 | $35,606 | $10,904 | $24,702 |
| 2014 | $4,332 | $33,591 | $10,287 | $23,304 |
Source: Public Records
Map
Nearby Homes
Your Personal Tour Guide
Ask me questions while you tour the home.