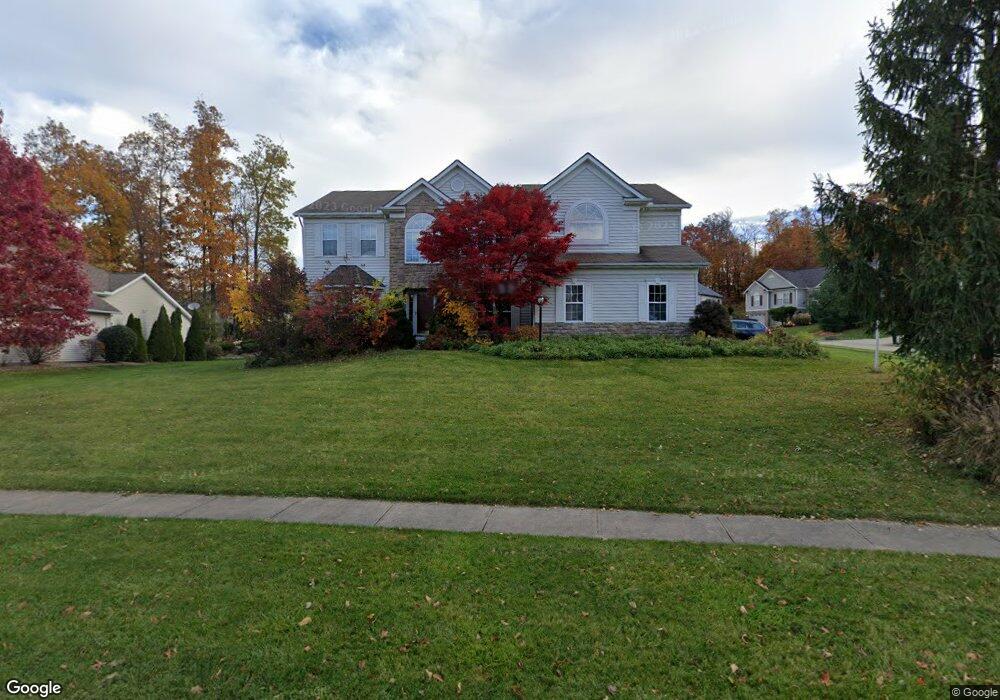
653 Marsh Way Brunswick, OH 44212
Estimated Value: $492,977 - $627,000
5
Beds
4
Baths
3,217
Sq Ft
$172/Sq Ft
Est. Value
About This Home
This home is located at 653 Marsh Way, Brunswick, OH 44212 and is currently estimated at $554,744, approximately $172 per square foot. 653 Marsh Way is a home located in Medina County with nearby schools including Walter Kidder Elementary School, Willets Middle School, and Brunswick High School.
Ownership History
Date
Name
Owned For
Owner Type
Purchase Details
Closed on
May 23, 2023
Sold by
Piskach Donald T
Bought by
Calaycay Jocelyn
Current Estimated Value
Purchase Details
Closed on
Mar 28, 2001
Sold by
L A Urban Inc
Bought by
Piskach Donald T and Piskach Jocelyn C
Home Financials for this Owner
Home Financials are based on the most recent Mortgage that was taken out on this home.
Original Mortgage
$248,200
Interest Rate
7.13%
Purchase Details
Closed on
Sep 15, 2000
Sold by
Ruth Wilson A General Partnership
Bought by
L A Urban Inc
Home Financials for this Owner
Home Financials are based on the most recent Mortgage that was taken out on this home.
Original Mortgage
$233,750
Interest Rate
8.14%
Purchase Details
Closed on
Feb 15, 1999
Sold by
Sacks Kenneth R
Bought by
Wilson Ruth
Create a Home Valuation Report for This Property
The Home Valuation Report is an in-depth analysis detailing your home's value as well as a comparison with similar homes in the area
Home Values in the Area
Average Home Value in this Area
Purchase History
| Date | Buyer | Sale Price | Title Company |
|---|---|---|---|
| Calaycay Jocelyn | -- | None Listed On Document | |
| Calaycay Jocelyn | -- | None Listed On Document | |
| Piskach Donald T | $279,800 | Ltic | |
| L A Urban Inc | $54,500 | Ltic | |
| Wilson Ruth | $145,500 | -- |
Source: Public Records
Mortgage History
| Date | Status | Borrower | Loan Amount |
|---|---|---|---|
| Previous Owner | Piskach Donald T | $248,200 | |
| Previous Owner | L A Urban Inc | $233,750 |
Source: Public Records
Tax History Compared to Growth
Tax History
| Year | Tax Paid | Tax Assessment Tax Assessment Total Assessment is a certain percentage of the fair market value that is determined by local assessors to be the total taxable value of land and additions on the property. | Land | Improvement |
|---|---|---|---|---|
| 2024 | $7,684 | $140,430 | $24,260 | $116,170 |
| 2023 | $7,684 | $140,430 | $24,260 | $116,170 |
| 2022 | $6,776 | $140,430 | $24,260 | $116,170 |
| 2021 | $6,688 | $111,450 | $19,250 | $92,200 |
| 2020 | $5,299 | $111,450 | $19,250 | $92,200 |
| 2019 | $5,233 | $111,450 | $19,250 | $92,200 |
| 2018 | $5,023 | $101,450 | $18,890 | $82,560 |
| 2017 | $5,030 | $101,450 | $18,890 | $82,560 |
| 2016 | $5,025 | $101,450 | $18,890 | $82,560 |
| 2015 | $4,810 | $93,940 | $17,490 | $76,450 |
| 2014 | $4,794 | $93,940 | $17,490 | $76,450 |
| 2013 | $4,688 | $93,940 | $17,490 | $76,450 |
Source: Public Records
Map
Nearby Homes
- 660 Marsh Way
- 4723 Baywood Dr
- 786 Pepperwood Dr
- 647 Pearl Rd
- 642 Topaz Ln
- 4630 Brookstone Ct
- 4340 Oak Ridge Trail
- 4431 Oak Ridge Trail
- 4332 Oak Ridge Trail
- 858 Quinebaug Ct
- 4597 Brushwood Cir
- 4626 Ruby Ln
- 4259 Pelham Way
- 833 Substation Rd
- 841 Substation Rd
- 4893 Grafton Rd
- 892 Crabapple Dr
- 4347 Oak Ridge Trail
- 4351 Oak Ridge Trail
- 4355 Oak Ridge Trail
- 630 Sandstone Way
- 659 Sandstone Way
- 655 Sandstone Way
- 624 Sandstone Way
- 649 Sandstone Way
- 635 Sandstone Way
- 652 Marsh Way
- 643 Sandstone Way
- 665 Marsh Way
- 629 Marsh Way
- 646 Marsh Way
- 664 Marsh Way
- 619 Marsh Way
- 616 Sandstone Way
- 640 Marsh Way
- 627 Sandstone Way
- 634 Marsh Way
- 612 Sandstone Way
- 626 Marsh Way
- 609 Marsh Way