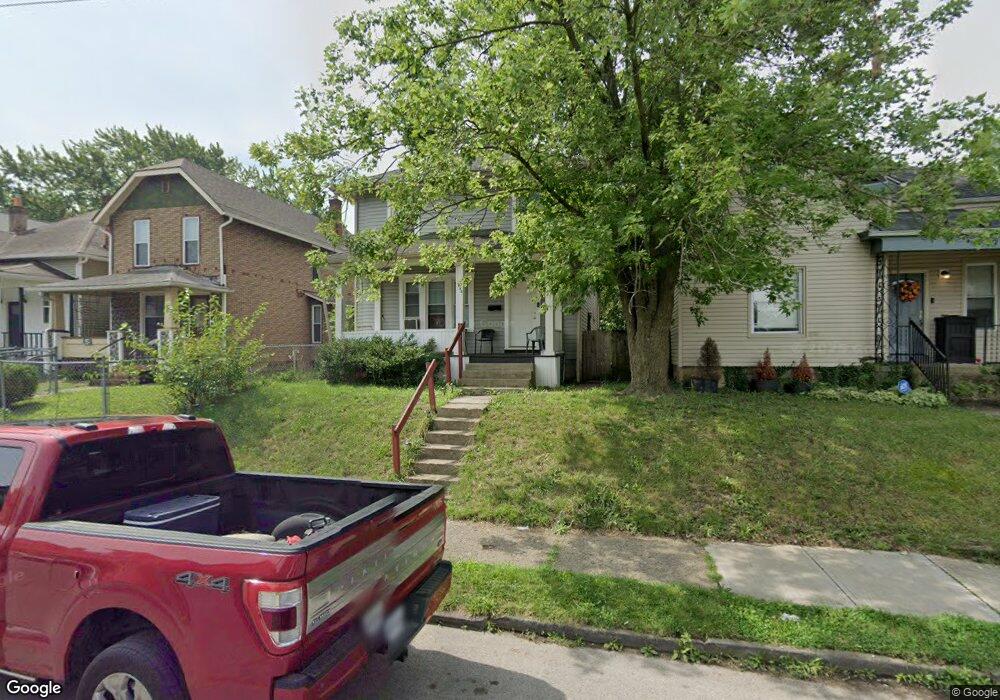
653 Siebert St Columbus, OH 43206
Karns Park NeighborhoodEstimated Value: $228,812 - $296,000
3
Beds
2
Baths
1,536
Sq Ft
$170/Sq Ft
Est. Value
About This Home
This home is located at 653 Siebert St, Columbus, OH 43206 and is currently estimated at $260,453, approximately $169 per square foot. 653 Siebert St is a home located in Franklin County with nearby schools including Lincoln Park Elementary School, South High School, and South Columbus Preparatory Academy.
Ownership History
Date
Name
Owned For
Owner Type
Purchase Details
Closed on
Jan 17, 2020
Sold by
Patriarch Bt Holdings Llc
Bought by
Patriarch Bt Investments Llc
Current Estimated Value
Purchase Details
Closed on
Nov 20, 2015
Sold by
Childrens Development Llc
Bought by
Patriarch Bt Holdings Llc
Purchase Details
Closed on
Nov 4, 2013
Sold by
Parker Georgia
Bought by
Childrens Development Llc
Purchase Details
Closed on
Feb 28, 2008
Sold by
Atfh Real Property Llc
Bought by
Parker Georgia
Purchase Details
Closed on
Feb 27, 2008
Sold by
American Tax Funding Llc
Bought by
Atfh Real Property Llc
Purchase Details
Closed on
Feb 25, 2007
Sold by
Sickler Deborah L and Leonard Edward
Bought by
American Tax Funding Llc
Purchase Details
Closed on
May 13, 1994
Bought by
Sickler Deborah L
Create a Home Valuation Report for This Property
The Home Valuation Report is an in-depth analysis detailing your home's value as well as a comparison with similar homes in the area
Home Values in the Area
Average Home Value in this Area
Purchase History
| Date | Buyer | Sale Price | Title Company |
|---|---|---|---|
| Patriarch Bt Investments Llc | -- | Chase Title | |
| Patriarch Bt Holdings Llc | $114,000 | Chase Title | |
| Childrens Development Llc | -- | None Available | |
| Parker Georgia | $15,300 | None Available | |
| Atfh Real Property Llc | -- | None Available | |
| American Tax Funding Llc | $11,000 | Atttorney | |
| Sickler Deborah L | -- | -- |
Source: Public Records
Tax History
| Year | Tax Paid | Tax Assessment Tax Assessment Total Assessment is a certain percentage of the fair market value that is determined by local assessors to be the total taxable value of land and additions on the property. | Land | Improvement |
|---|---|---|---|---|
| 2025 | $3,470 | $75,710 | $22,510 | $53,200 |
| 2024 | $3,470 | $75,710 | $22,510 | $53,200 |
| 2023 | $3,426 | $75,705 | $22,505 | $53,200 |
| 2022 | $1,555 | $29,270 | $5,430 | $23,840 |
| 2021 | $1,558 | $29,270 | $5,430 | $23,840 |
| 2020 | $1,607 | $29,270 | $5,430 | $23,840 |
| 2019 | $1,341 | $21,570 | $4,170 | $17,400 |
| 2018 | $1,128 | $21,570 | $4,170 | $17,400 |
| 2017 | $1,341 | $21,570 | $4,170 | $17,400 |
| 2016 | $1,008 | $14,840 | $3,360 | $11,480 |
| 2015 | $918 | $14,840 | $3,360 | $11,480 |
| 2014 | $920 | $14,840 | $3,360 | $11,480 |
| 2013 | $478 | $15,610 | $3,535 | $12,075 |
Source: Public Records
Map
Nearby Homes
- 735 Reinhard Ave
- 640 E Whittier St
- 550 Stewart Ave
- 790 Siebert St
- 000 Gilbert St
- 00 Gilbert St
- 779-781 Stanley Ave
- 530 Stewart Ave
- 630 Stanley Ave
- 516 Cline St
- 514 Cline St
- 512 Cline St
- 531 E Deshler Ave
- 510 Cline St
- 524 Thurman Ave
- 1178 Wager St
- 960 Carpenter St
- 1106-1116 Parsons Ave
- 693 Thurman Ave
- 539 Thurman Ave
- 649 Siebert St
- 657 Siebert St
- 643 Siebert St
- 661 Siebert St
- 641 Siebert St
- 665 Siebert St Unit 667
- 646 Stewart Ave
- 640 Stewart Ave
- 650 Stewart Ave
- 675 Siebert St
- 658 Stewart Ave
- 658 Stewart Ave Unit 502
- 634 Stewart Ave
- 1091 S 17th St
- 662 Stewart Ave
- 679 Siebert St
- 627 Siebert St
- 630 Stewart Ave
- 656 Siebert St
- 660 Siebert St
Your Personal Tour Guide
Ask me questions while you tour the home.