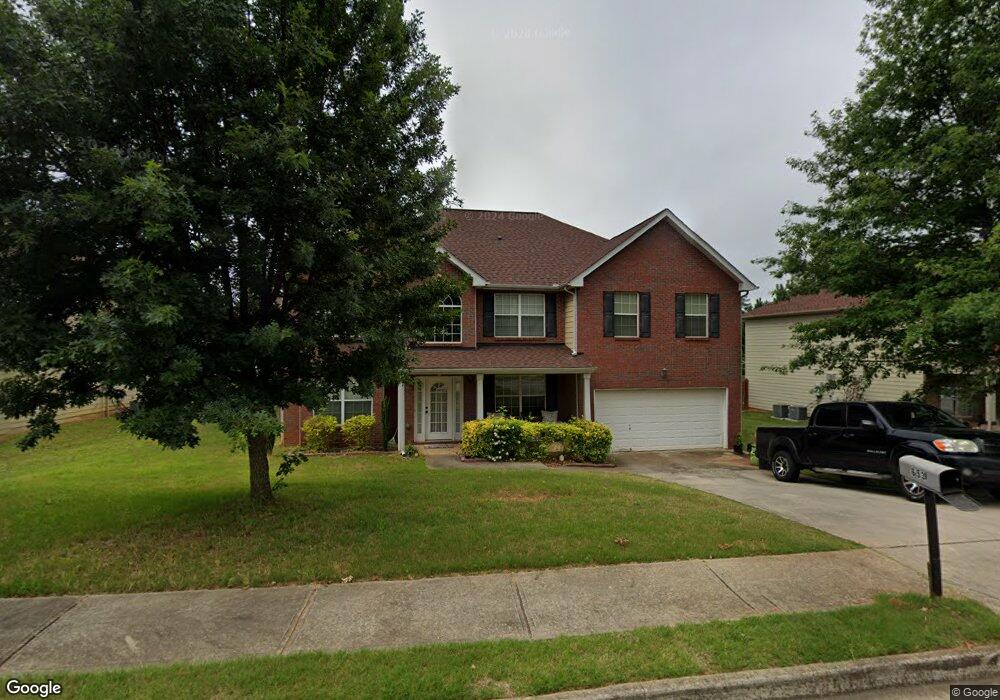
653 Toronto Cir Unit 80 Hampton, GA 30228
Estimated Value: $347,000 - $391,000
6
Beds
4
Baths
3,592
Sq Ft
$103/Sq Ft
Est. Value
About This Home
This home is located at 653 Toronto Cir Unit 80, Hampton, GA 30228 and is currently estimated at $370,804, approximately $103 per square foot. 653 Toronto Cir Unit 80 is a home located in Clayton County with nearby schools including River's Edge Elementary School, Eddie White Academy, and Lovejoy High School.
Ownership History
Date
Name
Owned For
Owner Type
Purchase Details
Closed on
Sep 26, 2014
Sold by
Singleton Benjamin
Bought by
Collins Trikedda M
Current Estimated Value
Home Financials for this Owner
Home Financials are based on the most recent Mortgage that was taken out on this home.
Original Mortgage
$123,717
Outstanding Balance
$96,275
Interest Rate
4.75%
Mortgage Type
FHA
Estimated Equity
$274,529
Purchase Details
Closed on
Mar 20, 2014
Sold by
Frank-Singleton Regina Ann
Bought by
Singleton Benjamin
Purchase Details
Closed on
Jan 11, 2007
Sold by
Legacy Communities Panhandle V
Bought by
Singleton Benjamin and Frank-Singleton Regina
Home Financials for this Owner
Home Financials are based on the most recent Mortgage that was taken out on this home.
Original Mortgage
$172,128
Interest Rate
6.05%
Mortgage Type
New Conventional
Create a Home Valuation Report for This Property
The Home Valuation Report is an in-depth analysis detailing your home's value as well as a comparison with similar homes in the area
Home Values in the Area
Average Home Value in this Area
Purchase History
| Date | Buyer | Sale Price | Title Company |
|---|---|---|---|
| Collins Trikedda M | $126,000 | -- | |
| Singleton Benjamin | -- | -- | |
| Singleton Benjamin | $215,200 | -- |
Source: Public Records
Mortgage History
| Date | Status | Borrower | Loan Amount |
|---|---|---|---|
| Open | Collins Trikedda M | $123,717 | |
| Previous Owner | Singleton Benjamin | $172,128 |
Source: Public Records
Tax History
| Year | Tax Paid | Tax Assessment Tax Assessment Total Assessment is a certain percentage of the fair market value that is determined by local assessors to be the total taxable value of land and additions on the property. | Land | Improvement |
|---|---|---|---|---|
| 2025 | $5,185 | $144,400 | $10,400 | $134,000 |
| 2024 | $5,225 | $142,960 | $10,400 | $132,560 |
| 2023 | $5,214 | $144,400 | $10,400 | $134,000 |
| 2022 | $4,294 | $118,440 | $10,400 | $108,040 |
| 2021 | $3,134 | $88,400 | $10,400 | $78,000 |
| 2020 | $3,062 | $85,600 | $10,400 | $75,200 |
| 2019 | $1,938 | $56,800 | $9,600 | $47,200 |
| 2018 | $1,938 | $56,800 | $9,600 | $47,200 |
| 2017 | $1,942 | $60,238 | $9,600 | $50,638 |
| 2016 | $2,082 | $60,238 | $9,600 | $50,638 |
| 2015 | $1,655 | $0 | $0 | $0 |
| 2014 | $2,538 | $73,785 | $9,600 | $64,185 |
Source: Public Records
Map
Nearby Homes
- 609 Vaughan Dr
- 12095 Panhandle Rd
- 11961 Markham Way
- 12090 Centerra Dr
- 609 Caledon Way
- 570 Oakville Trail
- 12149 Centerra Dr
- 536 Caledon Way
- 12140 Dominion Dr
- 11800 Guelph Cir
- 12237 Dickson Rd Unit 1
- 424 Toronto Cir
- 12283 Coldstream Ct
- 526 Canady Ct
- 411 Toronto Cir
- 11846 Pine Needle Ln
- 12123 Edgewater Dr
- 12359 Hillcrest Dr
- 0 Haley Ln Unit 10708324
- 12328 Edgewater Dr
- 653 Toronto Cir
- 659 Toronto Cir
- 647 Toronto Cir
- 650 Vaughan Dr
- 641 Toronto Cir
- 644 Vaughan Dr
- 665 Toronto Cir
- 652 Toronto Cir
- 646 Toronto Cir
- 638 Vaughan Dr Unit 74
- 638 Vaughan Dr
- 656 Vaughan Dr
- 658 Toronto Cir
- 640 Toronto Cir
- 635 Toronto Cir
- 664 Toronto Cir
- 632 Vaughan Dr
- 634 Toronto Cir
- 629 Toronto Cir
- 663 Caledon Way
Your Personal Tour Guide
Ask me questions while you tour the home.