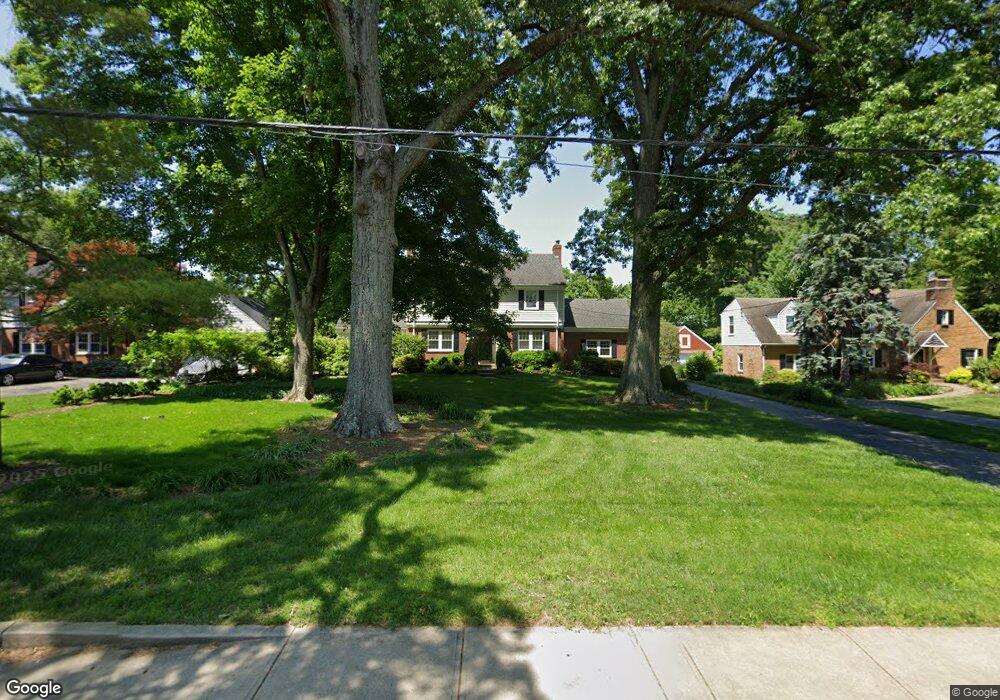
6530 Shawnee Run Rd Cincinnati, OH 45243
Estimated Value: $565,000 - $755,000
3
Beds
2
Baths
2,252
Sq Ft
$281/Sq Ft
Est. Value
About This Home
This home is located at 6530 Shawnee Run Rd, Cincinnati, OH 45243 and is currently estimated at $633,063, approximately $281 per square foot. 6530 Shawnee Run Rd is a home located in Hamilton County with nearby schools including Madeira Elementary School, Madeira Middle School, and Madeira High School.
Ownership History
Date
Name
Owned For
Owner Type
Purchase Details
Closed on
Sep 16, 2005
Sold by
Vallis Courtland B and Hudson Lori Anne I
Bought by
Vallis Bruce and Hudson Lori Anne
Current Estimated Value
Purchase Details
Closed on
Jul 26, 2001
Sold by
Bott Michael A and Bott Cynthia
Bought by
Vallis Courtland B and Hudson Lori Anne I
Home Financials for this Owner
Home Financials are based on the most recent Mortgage that was taken out on this home.
Original Mortgage
$228,000
Interest Rate
7.11%
Purchase Details
Closed on
Dec 14, 1995
Sold by
Toedtman John K and Toedtman Melissa H
Bought by
Bott Michael A and Bott Cynthia M
Home Financials for this Owner
Home Financials are based on the most recent Mortgage that was taken out on this home.
Original Mortgage
$154,150
Interest Rate
7.42%
Create a Home Valuation Report for This Property
The Home Valuation Report is an in-depth analysis detailing your home's value as well as a comparison with similar homes in the area
Home Values in the Area
Average Home Value in this Area
Purchase History
| Date | Buyer | Sale Price | Title Company |
|---|---|---|---|
| Vallis Bruce | -- | None Available | |
| Vallis Courtland B | $285,000 | -- | |
| Bott Michael A | -- | -- |
Source: Public Records
Mortgage History
| Date | Status | Borrower | Loan Amount |
|---|---|---|---|
| Previous Owner | Vallis Courtland B | $228,000 | |
| Previous Owner | Bott Michael A | $154,150 |
Source: Public Records
Tax History
| Year | Tax Paid | Tax Assessment Tax Assessment Total Assessment is a certain percentage of the fair market value that is determined by local assessors to be the total taxable value of land and additions on the property. | Land | Improvement |
|---|---|---|---|---|
| 2025 | $10,174 | $173,019 | $43,708 | $129,311 |
| 2024 | $9,910 | $173,019 | $43,708 | $129,311 |
| 2023 | $10,042 | $173,019 | $43,708 | $129,311 |
| 2022 | $9,933 | $139,906 | $32,634 | $107,272 |
| 2021 | $9,721 | $139,906 | $32,634 | $107,272 |
| 2020 | $8,994 | $139,906 | $32,634 | $107,272 |
| 2019 | $8,703 | $124,916 | $29,138 | $95,778 |
| 2018 | $8,773 | $124,916 | $29,138 | $95,778 |
| 2017 | $8,319 | $124,916 | $29,138 | $95,778 |
| 2016 | $8,382 | $118,693 | $28,557 | $90,136 |
| 2015 | $7,754 | $118,693 | $28,557 | $90,136 |
| 2014 | $7,798 | $118,693 | $28,557 | $90,136 |
| 2013 | $7,707 | $113,040 | $27,195 | $85,845 |
Source: Public Records
Map
Nearby Homes
- 6242 Fulsher Ln
- 6752 Rose Crest Ave
- 7002 Dawson Rd
- 6041 Johnson St
- 5995 Crabtree Ln
- 7437 Madeira Pines Dr
- 7406 Dawson Rd
- 6441 Euclid Ave
- 5801 Kenwood Rd
- 7335 Demar Rd
- 7474 Dawson Rd
- 5804 Hickory Ct
- 5800 Cherokee Dr
- 5802 Hickory Ct
- 5801 Hickory Ct
- 7025 Wallace Ave
- 6300 Miami Rd
- 7301 Euclid Ave
- 5570 Windridge Dr
- 5906 Woodland Ln
- 6554 Shawnee Run Rd
- 6506 Shawnee Run Rd
- 6578 Shawnee Run Rd
- 6482 Shawnee Run Rd
- 6520 Rollymeade Ave
- 6519 Rollymeade Ave
- 6462 Shawnee Run Rd
- 6557 Shawnee Run Rd
- 6602 Shawnee Run Rd
- 6475 Shawnee Run Rd
- 6440 Shawnee Run Rd
- 6299 Kaywood Dr
- 6626 Shawnee Run Rd
- 6420 Kenwood Rd
- 6410 Kenwood Rd
- 6524 Rollymeade Ave
- 6449 Shawnee Run Rd
- 6525 Rollymeade Ave
- 6689 Apache Cir
- 6679 Apache Cir