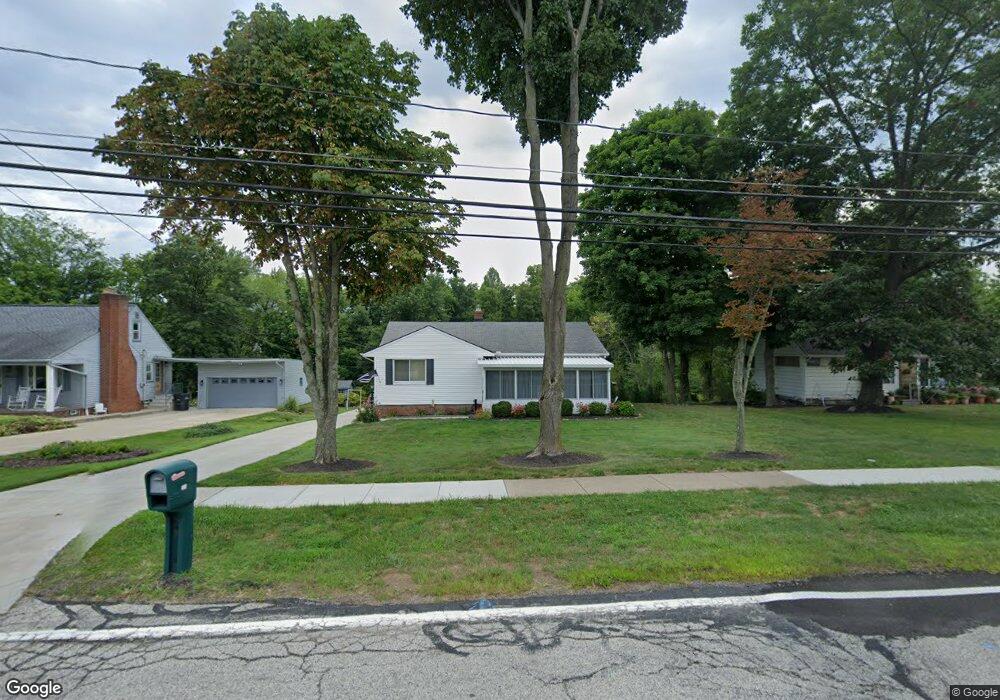
6531 Brookside Rd Independence, OH 44131
Estimated Value: $240,243 - $279,000
3
Beds
2
Baths
1,104
Sq Ft
$240/Sq Ft
Est. Value
About This Home
This home is located at 6531 Brookside Rd, Independence, OH 44131 and is currently estimated at $264,811, approximately $239 per square foot. 6531 Brookside Rd is a home located in Cuyahoga County with nearby schools including Independence Primary School, Independence Middle School, and Independence High School.
Ownership History
Date
Name
Owned For
Owner Type
Purchase Details
Closed on
Oct 3, 2013
Sold by
Repicky Kevin J
Bought by
Repicky Kevin J and Repicky Chelsey L
Current Estimated Value
Purchase Details
Closed on
Apr 22, 2008
Sold by
Denallo Dana A and Denallo Frank
Bought by
Repicky Kevin J
Home Financials for this Owner
Home Financials are based on the most recent Mortgage that was taken out on this home.
Original Mortgage
$142,500
Outstanding Balance
$89,179
Interest Rate
6.17%
Mortgage Type
Purchase Money Mortgage
Estimated Equity
$175,632
Purchase Details
Closed on
Oct 3, 2006
Sold by
Leonard Lori
Bought by
Denallo Dana A
Home Financials for this Owner
Home Financials are based on the most recent Mortgage that was taken out on this home.
Original Mortgage
$110,500
Interest Rate
8.65%
Mortgage Type
Purchase Money Mortgage
Purchase Details
Closed on
Jan 1, 1975
Bought by
Kleinschmidt Frederick C
Create a Home Valuation Report for This Property
The Home Valuation Report is an in-depth analysis detailing your home's value as well as a comparison with similar homes in the area
Home Values in the Area
Average Home Value in this Area
Purchase History
| Date | Buyer | Sale Price | Title Company |
|---|---|---|---|
| Repicky Kevin J | -- | Attorney | |
| Repicky Kevin J | $150,000 | Boulevard Title Agency | |
| Denallo Dana A | $130,000 | Boulevard Title Agency | |
| Kleinschmidt Frederick C | -- | -- |
Source: Public Records
Mortgage History
| Date | Status | Borrower | Loan Amount |
|---|---|---|---|
| Open | Repicky Kevin J | $142,500 | |
| Previous Owner | Denallo Dana A | $110,500 |
Source: Public Records
Tax History
| Year | Tax Paid | Tax Assessment Tax Assessment Total Assessment is a certain percentage of the fair market value that is determined by local assessors to be the total taxable value of land and additions on the property. | Land | Improvement |
|---|---|---|---|---|
| 2025 | $3,643 | $78,890 | $15,785 | $63,105 |
| 2024 | $3,773 | $78,890 | $15,785 | $63,105 |
| 2023 | $3,412 | $64,830 | $16,070 | $48,760 |
| 2022 | $3,393 | $64,820 | $16,070 | $48,760 |
| 2021 | $3,344 | $64,820 | $16,070 | $48,760 |
| 2020 | $3,269 | $59,470 | $14,740 | $44,730 |
| 2019 | $3,156 | $169,900 | $42,100 | $127,800 |
| 2018 | $3,215 | $64,400 | $14,740 | $49,670 |
| 2017 | $3,077 | $55,380 | $12,430 | $42,950 |
| 2016 | $3,013 | $54,780 | $12,430 | $42,350 |
| 2015 | -- | $54,780 | $12,430 | $42,350 |
| 2014 | -- | $50,720 | $11,520 | $39,200 |
Source: Public Records
Map
Nearby Homes
- 6312 E Pleasant Valley Rd
- 7572 Scenicview Dr
- SL 23 Kingscote Park
- 7003 Brecksville Rd
- 6119 E Sprague Rd
- 4730 Eastview Dr
- 6626 Hawthorne Dr
- 7040 Brecksville Rd
- 6752 Rivercrest Dr
- 4469 Shelly Dr
- 7817 Daniel Dr
- 3347 Jasmine Dr
- VL TBB Laura Lee Ln
- VL Laura Lee Ln
- 6878 W Fitzwater Rd Unit 41
- 6930 Carriage Hill Dr Unit 101
- 6910 Carriage Hill Dr Unit 101
- 6910 Carriage Hill Dr Unit 104
- 7647 Mccreary Rd
- 7840 Mccreary Rd
- 6607 Brookside Rd
- 6523 Brookside Rd
- 6613 Brookside Rd
- 6515 Brookside Rd
- 7471 Midland Rd
- 7463 Midland Rd
- 7480 Oval Dr
- 6621 Brookside Rd
- 7447 Midland Rd
- 6507 Brookside Rd
- 6528 Brookside Rd
- 6608 Brookside Rd
- 7443 Midland Rd
- 6520 Brookside Rd
- 7472 Oval Dr
- 6690 Brookside Rd
- 6508 Brookside Rd
- 7439 Midland Rd
- 6715 Brookside Rd
- 6419 Brookside Rd
Your Personal Tour Guide
Ask me questions while you tour the home.