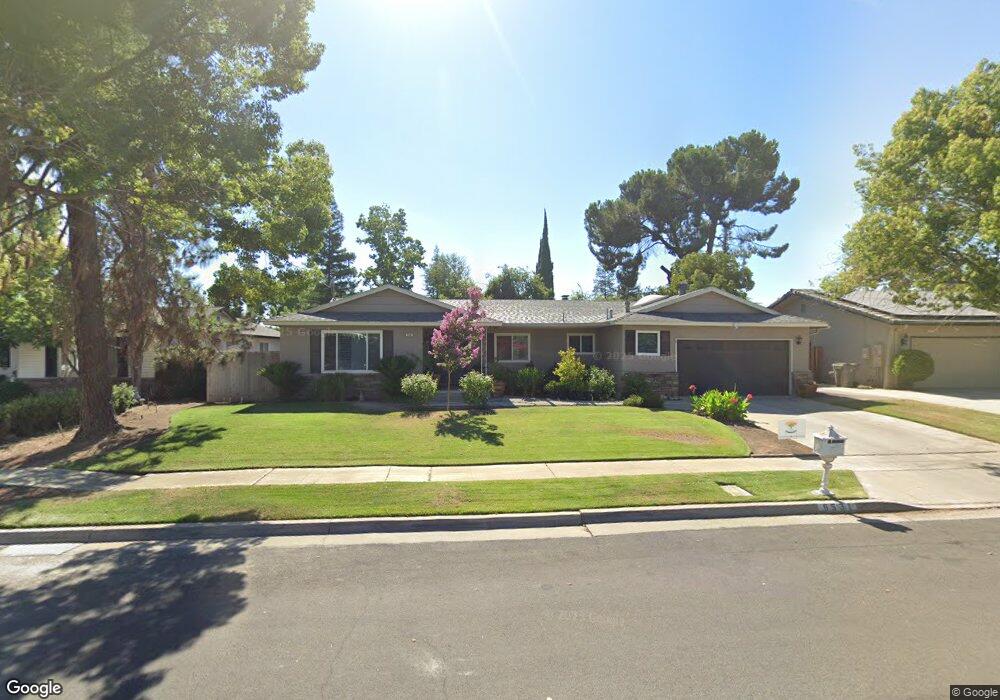
6531 N Teilman Ave Fresno, CA 93711
Bullard NeighborhoodEstimated Value: $463,731 - $505,000
3
Beds
2
Baths
2,084
Sq Ft
$233/Sq Ft
Est. Value
About This Home
This home is located at 6531 N Teilman Ave, Fresno, CA 93711 and is currently estimated at $485,183, approximately $232 per square foot. 6531 N Teilman Ave is a home located in Fresno County with nearby schools including Starr Elementary School, Tenaya Middle School, and Bullard High School.
Ownership History
Date
Name
Owned For
Owner Type
Purchase Details
Closed on
Jul 29, 2015
Sold by
Silva Linda S and Burris Linda S
Bought by
Silva Linda S
Current Estimated Value
Home Financials for this Owner
Home Financials are based on the most recent Mortgage that was taken out on this home.
Original Mortgage
$200,000
Outstanding Balance
$157,031
Interest Rate
3.98%
Mortgage Type
New Conventional
Estimated Equity
$328,152
Purchase Details
Closed on
Feb 4, 2009
Sold by
Burris Steve A and Burris Linda S
Bought by
Burris Linda S
Purchase Details
Closed on
Jun 26, 2008
Sold by
Burris Steve and Burris Linda
Bought by
Harris Steve A and Burris Linda S
Purchase Details
Closed on
Oct 6, 1998
Sold by
David Miller
Bought by
Burris Steven and Burris Linda
Home Financials for this Owner
Home Financials are based on the most recent Mortgage that was taken out on this home.
Original Mortgage
$117,075
Interest Rate
6.61%
Mortgage Type
FHA
Purchase Details
Closed on
Dec 26, 1996
Sold by
Driplines Inc G R
Bought by
Miller David and Miller Sarit
Create a Home Valuation Report for This Property
The Home Valuation Report is an in-depth analysis detailing your home's value as well as a comparison with similar homes in the area
Home Values in the Area
Average Home Value in this Area
Purchase History
| Date | Buyer | Sale Price | Title Company |
|---|---|---|---|
| Silva Linda S | -- | None Available | |
| Burris Linda S | -- | None Available | |
| Burris Steve A | -- | None Available | |
| Harris Steve A | -- | None Available | |
| Burris Steven | $118,000 | Fidelity National Title Co | |
| Miller David | -- | -- |
Source: Public Records
Mortgage History
| Date | Status | Borrower | Loan Amount |
|---|---|---|---|
| Open | Silva Linda S | $200,000 | |
| Closed | Burris Steven | $117,075 |
Source: Public Records
Tax History Compared to Growth
Tax History
| Year | Tax Paid | Tax Assessment Tax Assessment Total Assessment is a certain percentage of the fair market value that is determined by local assessors to be the total taxable value of land and additions on the property. | Land | Improvement |
|---|---|---|---|---|
| 2025 | $2,265 | $184,967 | $54,857 | $130,110 |
| 2023 | $2,319 | $177,786 | $52,728 | $125,058 |
| 2022 | $2,192 | $174,301 | $51,695 | $122,606 |
| 2021 | $2,131 | $170,884 | $50,682 | $120,202 |
| 2020 | $2,122 | $169,133 | $50,163 | $118,970 |
| 2019 | $2,040 | $165,818 | $49,180 | $116,638 |
| 2018 | $1,996 | $162,567 | $48,216 | $114,351 |
| 2017 | $1,962 | $159,380 | $47,271 | $112,109 |
| 2016 | $1,813 | $156,256 | $46,345 | $109,911 |
| 2015 | $1,784 | $153,910 | $45,649 | $108,261 |
| 2014 | $1,747 | $150,896 | $44,755 | $106,141 |
Source: Public Records
Map
Nearby Homes
- 6569 N Teilman Ave
- 6671 N Channing Way
- 1654 W Vartikian Ave
- 6447 N Vagedes Ave
- 6753 N Durant Ave
- 1590 W Escalon Ave
- 6518 N Dolores Ave
- 1611 W Escalon Ave
- 1387 W Sample Ave
- 7047 N Teilman Ave Unit 101
- 7047 N Teilman Ave Unit 102
- 6743 N Dolores Ave
- 6658 N Thorne Ave
- 2246 W Palo Alto Ave
- 6594 N Farris Ave
- 1709 W Calimyrna Ave Unit 9A
- 1545 W Calimyrna Ave
- 2284 W Palo Alto Ave
- 6670 N Sequoia Ave
- 2076 W Calimyrna Ave Unit 102
- 6519 N Teilman Ave
- 1623 W Los Altos Ave
- 1624 W Los Altos Ave
- 6507 N Teilman Ave
- 6555 N Teilman Ave
- 1565 W Paul Ave
- 1568 W Paul Ave
- 1629 W Los Altos Ave
- 1620 W Paul Ave
- 1564 W Menlo Ave
- 1630 W Los Altos Ave
- 1551 W Paul Ave
- 6491 N Teilman Ave
- 1628 W Paul Ave
- 1607 W Palo Alto Ave
- 1552 W Paul Ave
- 1567 W Palo Alto Ave
- 1550 W Menlo Ave
- 1623 W Palo Alto Ave
- 1637 W Los Altos Ave