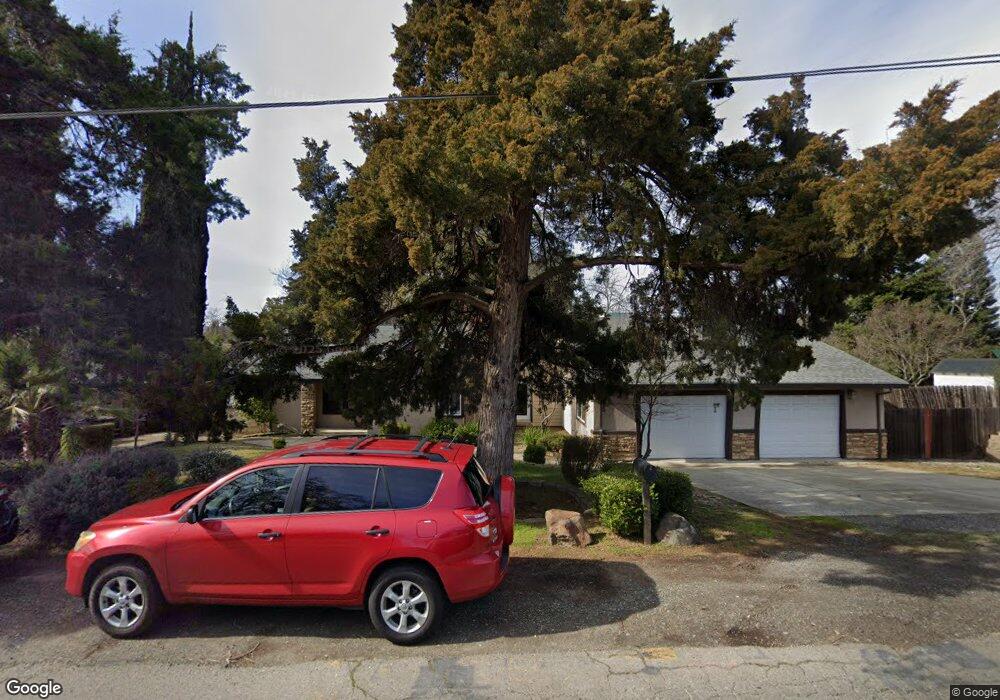
6533 Filbert Ave Orangevale, CA 95662
Estimated Value: $625,000 - $764,000
3
Beds
2
Baths
1,986
Sq Ft
$344/Sq Ft
Est. Value
About This Home
This home is located at 6533 Filbert Ave, Orangevale, CA 95662 and is currently estimated at $683,094, approximately $343 per square foot. 6533 Filbert Ave is a home located in Sacramento County with nearby schools including Ottomon Way Elementary School, Louis Pasteur Fundamental Middle School, and Casa Roble Fundamental High School.
Ownership History
Date
Name
Owned For
Owner Type
Purchase Details
Closed on
Mar 2, 2015
Sold by
Becker Zeb X
Bought by
Becker Zeb X and Becker Jodie L
Current Estimated Value
Home Financials for this Owner
Home Financials are based on the most recent Mortgage that was taken out on this home.
Original Mortgage
$258,750
Outstanding Balance
$197,369
Interest Rate
3.57%
Mortgage Type
New Conventional
Estimated Equity
$485,725
Purchase Details
Closed on
Jul 17, 2003
Sold by
Cruz Stephanie Ann
Bought by
Becker Zeb X
Home Financials for this Owner
Home Financials are based on the most recent Mortgage that was taken out on this home.
Original Mortgage
$242,000
Interest Rate
6.12%
Mortgage Type
Purchase Money Mortgage
Purchase Details
Closed on
Mar 3, 2003
Sold by
Cruz Stephanie Ann and John P & Delphine H Forrest Re
Bought by
Cruz Stephanie Ann
Purchase Details
Closed on
Jun 1, 1994
Sold by
Forrest John P and Forrest Delphine H
Bought by
Forrest John P and Forrest Delphine H
Create a Home Valuation Report for This Property
The Home Valuation Report is an in-depth analysis detailing your home's value as well as a comparison with similar homes in the area
Home Values in the Area
Average Home Value in this Area
Purchase History
| Date | Buyer | Sale Price | Title Company |
|---|---|---|---|
| Becker Zeb X | -- | First American Title | |
| Becker Zeb X | $242,000 | Financial Title Company | |
| Cruz Stephanie Ann | -- | -- | |
| Forrest John P | -- | -- |
Source: Public Records
Mortgage History
| Date | Status | Borrower | Loan Amount |
|---|---|---|---|
| Open | Becker Zeb X | $258,750 | |
| Closed | Becker Zeb X | $242,000 |
Source: Public Records
Tax History
| Year | Tax Paid | Tax Assessment Tax Assessment Total Assessment is a certain percentage of the fair market value that is determined by local assessors to be the total taxable value of land and additions on the property. | Land | Improvement |
|---|---|---|---|---|
| 2025 | $5,581 | $469,779 | $48,329 | $421,450 |
| 2024 | $5,581 | $460,569 | $47,382 | $413,187 |
| 2023 | $5,433 | $451,539 | $46,453 | $405,086 |
| 2022 | $5,405 | $442,687 | $45,543 | $397,144 |
| 2021 | $5,323 | $434,007 | $44,650 | $389,357 |
| 2020 | $5,224 | $429,558 | $44,193 | $385,365 |
| 2019 | $5,120 | $421,136 | $43,327 | $377,809 |
| 2018 | $5,061 | $412,879 | $42,478 | $370,401 |
| 2017 | $4,645 | $374,772 | $89,944 | $284,828 |
| 2016 | $4,029 | $340,703 | $81,768 | $258,935 |
| 2015 | $3,750 | $324,480 | $77,875 | $246,605 |
| 2014 | $3,600 | $312,000 | $74,880 | $237,120 |
Source: Public Records
Map
Nearby Homes
- 9184 Central Ave
- 9065 Wickstrom Dr
- 9028 Wickstrom Dr
- 9022 Wickstrom Dr
- 8999 Wickstrom Dr
- 8981 Wickstrom Dr
- 8987 Wickstrom Dr
- 8993 Wickstrom Dr
- 8924 Maple Hill Ln
- 6805 Chestnut Ave
- 8875 Wickstrom Dr
- 6217 Green Eyes Way
- 6422 Hazel Ave
- 6600 Rosa Prado Ct
- 9077 Westeria Way
- 6024 Mcneely Way
- 9340 Orangevale Ave Unit 26
- 9340 Orangevale Ave Unit 38
- 9340 Orangevale Ave Unit 27
- 8856 Venikov Place
- 6525 Filbert Ave
- 9094 Central Ave
- 9098 Central Ave
- 8933 Cape Windham Place
- 9084 Central Ave
- 6519 Filbert Ave
- 6516 Filbert Ave
- 9076 Central Ave
- 6508 Filbert Ave
- 8937 Cape Windham Place
- 8928 Cape Windham Place
- 9095 Central Ave
- 6504 Filbert Ave
- 6604 Filbert Ave
- 9083 Central Ave
- 9068 Central Ave
- 9115 Central Ave
- 8946 Cape Windham Place
- 6511 Filbert Ave
- 8924 Cape Windham Place
Your Personal Tour Guide
Ask me questions while you tour the home.