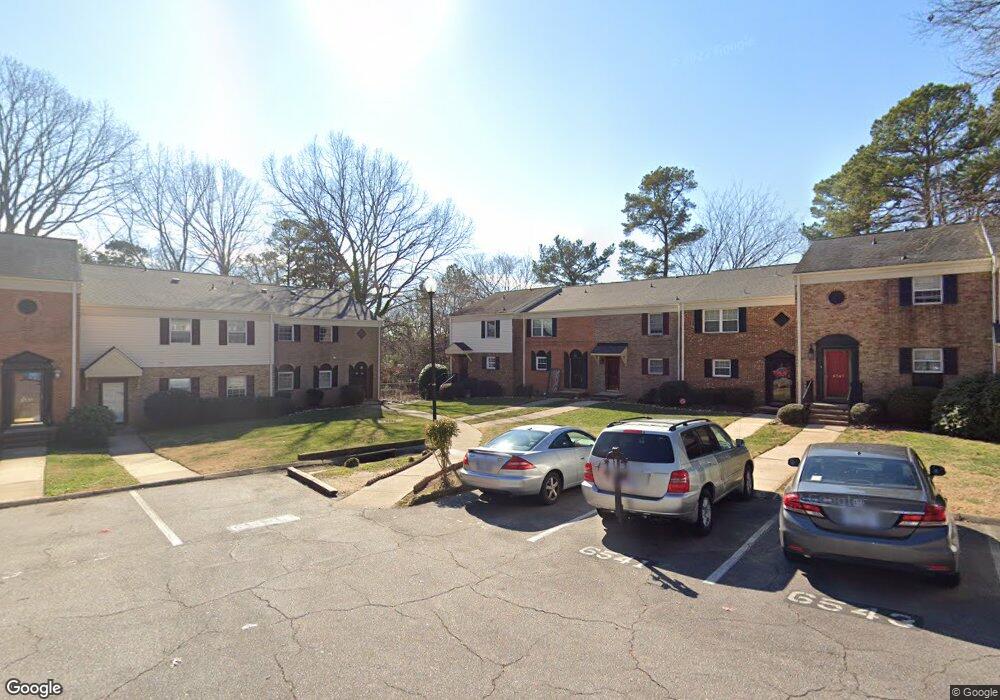
6535 New Market Way Unit 6535 Raleigh, NC 27615
North Ridge NeighborhoodEstimated Value: $234,000 - $344,798
3
Beds
3
Baths
2,215
Sq Ft
$139/Sq Ft
Est. Value
About This Home
This home is located at 6535 New Market Way Unit 6535, Raleigh, NC 27615 and is currently estimated at $307,200, approximately $138 per square foot. 6535 New Market Way Unit 6535 is a home located in Wake County with nearby schools including North Ridge Elementary School, West Millbrook Middle School, and Millbrook High School.
Ownership History
Date
Name
Owned For
Owner Type
Purchase Details
Closed on
Sep 16, 2021
Sold by
Vertefay Properties Llc
Bought by
Tran Long D and Parayno Tj
Current Estimated Value
Home Financials for this Owner
Home Financials are based on the most recent Mortgage that was taken out on this home.
Original Mortgage
$209,625
Outstanding Balance
$190,458
Interest Rate
2.7%
Mortgage Type
New Conventional
Estimated Equity
$116,742
Purchase Details
Closed on
Aug 16, 2012
Sold by
Murray David O and Estate Of Marsha Murray Walton
Bought by
Vertefeuille Dane R
Purchase Details
Closed on
Oct 16, 2003
Sold by
Finn Joseph E and Finn Cynthia A
Bought by
Walton Marsha Murray
Purchase Details
Closed on
May 5, 1999
Sold by
Gould Mattias M
Bought by
Finn Joseph E and Finn Cynthia A
Create a Home Valuation Report for This Property
The Home Valuation Report is an in-depth analysis detailing your home's value as well as a comparison with similar homes in the area
Home Values in the Area
Average Home Value in this Area
Purchase History
| Date | Buyer | Sale Price | Title Company |
|---|---|---|---|
| Tran Long D | $289,500 | None Available | |
| Tran Long D | $289,500 | None Listed On Document | |
| Vertefeuille Dane R | $113,000 | None Available | |
| Walton Marsha Murray | $140,000 | -- | |
| Finn Joseph E | $129,000 | -- |
Source: Public Records
Mortgage History
| Date | Status | Borrower | Loan Amount |
|---|---|---|---|
| Open | Tran Long D | $209,625 | |
| Closed | Tran Long D | $209,625 |
Source: Public Records
Tax History Compared to Growth
Tax History
| Year | Tax Paid | Tax Assessment Tax Assessment Total Assessment is a certain percentage of the fair market value that is determined by local assessors to be the total taxable value of land and additions on the property. | Land | Improvement |
|---|---|---|---|---|
| 2025 | $2,877 | $327,618 | -- | $327,618 |
| 2024 | $2,865 | $327,618 | $0 | $327,618 |
| 2023 | $2,302 | $209,391 | $0 | $209,391 |
| 2022 | $2,140 | $209,391 | $0 | $209,391 |
| 2021 | $1,738 | $176,562 | $0 | $176,562 |
| 2020 | $1,707 | $176,562 | $0 | $176,562 |
| 2019 | $1,647 | $140,414 | $0 | $140,414 |
| 2018 | $1,554 | $140,414 | $0 | $140,414 |
| 2017 | $1,481 | $140,414 | $0 | $140,414 |
| 2016 | $1,451 | $140,414 | $0 | $140,414 |
| 2015 | $1,413 | $134,487 | $0 | $134,487 |
| 2014 | $1,340 | $134,487 | $0 | $134,487 |
Source: Public Records
Map
Nearby Homes
- 6423 New Market Way Unit 6423
- 6379 New Market Way
- 6312 New Market Way
- 1209 Briar Patch Ln
- 1217 Briar Patch Ln
- 1412 Pony Run Rd
- 7050 Sandy Forks Rd Unit 101
- 7010 Sandy Forks Rd Unit 103
- 1401 Spring Forest Rd
- 6504 Jade Tree Ln
- 1516 Hemphill Dr
- 1700 Pony Run Rd
- 1208 Barcroft Place
- 1208 Hunting Ridge Rd
- 1216 Barcroft Place
- 6832 Greystone Dr
- 906 Albany Ct
- 6844 Greystone Dr
- 1524 Edgeside Ct
- 5946 Carmel Ln
- 6535 New Market Way
- 6535 New Market Way Unit END
- 6533 New Market Way Unit 6533
- 6531 New Market Way Unit 6531
- 6531 New Market Way Unit 1
- 6539 New Market Way Unit 6539
- 6541 New Market Way
- 6529 New Market Way Unit 6529
- 6529 New Market Way Unit 1
- 6543 New Market Way Unit 6543
- 6545 New Market Way
- 6547 New Market Way Unit 6547
- 6549 New Market Way Unit 6549
- 6447 New Market Way Unit 6447
- 6447 New Market Way Unit n/a
- 6449 New Market Way Unit 6449
- 6523 New Market Way Unit 6523
- 6551 New Market Way
- 6443 New Market Way Unit 6443
- 6451 New Market Way Unit 6451