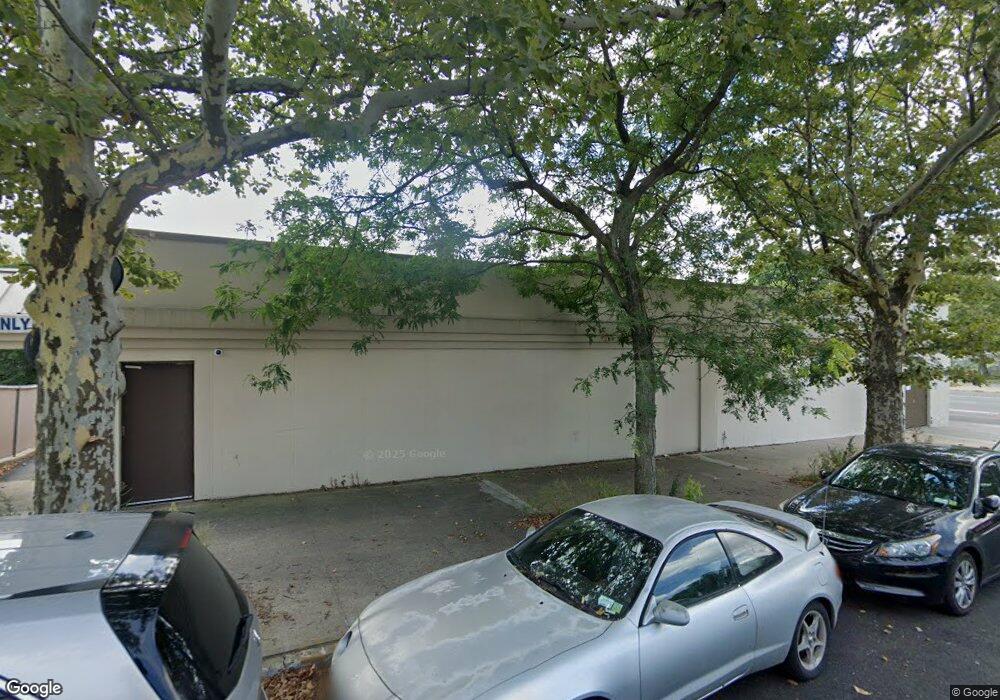
6535 Woodhaven Blvd Flushing, NY 11374
Rego Park NeighborhoodEstimated Value: $5,499,873
--
Bed
--
Bath
9,548
Sq Ft
$576/Sq Ft
Est. Value
About This Home
This home is located at 6535 Woodhaven Blvd, Flushing, NY 11374 and is currently estimated at $5,499,873, approximately $576 per square foot. 6535 Woodhaven Blvd is a home located in Queens County with nearby schools including P.S. 174 - William Sidney Mount, J.H.S. 190 Russell Sage, and Queens Metropolitan High School.
Ownership History
Date
Name
Owned For
Owner Type
Purchase Details
Closed on
Jul 31, 2024
Sold by
1105 First Associates Llc
Bought by
Iri Innovative Resources For Independen
Current Estimated Value
Purchase Details
Closed on
Jun 24, 2004
Sold by
As Executor Of Elise Robbins and Robbins
Bought by
Herzog Marcia G and Robbins Ilene Hope
Purchase Details
Closed on
Apr 7, 2004
Sold by
Being All The Heirs At Law And Distribut and Dorothy Gonsky Deceased
Bought by
Krass Janice and Robbins Depamphilis Susan
Purchase Details
Closed on
Apr 2, 2002
Sold by
Robbins Richard
Bought by
Cohn Arline
Purchase Details
Closed on
Feb 20, 2002
Sold by
Robbins Family Trust and Robbins Richard
Bought by
Robbins Richard
Purchase Details
Closed on
Oct 10, 2001
Sold by
Robbins Phyllis and Robbins Mac
Bought by
Robbins Family Trust
Purchase Details
Closed on
Jan 15, 1998
Sold by
Robbins Mac and Robinowitz Samuel
Bought by
Gonsky Dorothy and Robbins Mac
Purchase Details
Closed on
Aug 20, 1997
Sold by
Robbins Elsie and Herzog Marcia Gail
Bought by
Robbins Phyllis
Create a Home Valuation Report for This Property
The Home Valuation Report is an in-depth analysis detailing your home's value as well as a comparison with similar homes in the area
Home Values in the Area
Average Home Value in this Area
Purchase History
| Date | Buyer | Sale Price | Title Company |
|---|---|---|---|
| Iri Innovative Resources For Independen | $5,200,000 | -- | |
| Herzog Marcia G | -- | -- | |
| Herzog Marcia G | -- | -- | |
| Krass Janice | -- | -- | |
| Krass Janice | -- | -- | |
| Cohn Arline | -- | -- | |
| Cohn Arline | -- | -- | |
| Robbins Richard | -- | -- | |
| Robbins Richard | -- | -- | |
| Robbins Family Trust | -- | -- | |
| Robbins Family Trust | -- | -- | |
| Gonsky Dorothy | -- | Ticor Title Guarantee Compan | |
| Gonsky Dorothy | -- | Ticor Title Guarantee Compan | |
| Robbins Phyllis | $25,000 | Ticor Title Guarantee Compan | |
| Robbins Phyllis | -- | Ticor Title Guarantee Compan |
Source: Public Records
Tax History Compared to Growth
Tax History
| Year | Tax Paid | Tax Assessment Tax Assessment Total Assessment is a certain percentage of the fair market value that is determined by local assessors to be the total taxable value of land and additions on the property. | Land | Improvement |
|---|---|---|---|---|
| 2025 | $157,786 | $1,560,770 | $508,500 | $1,052,270 |
| 2024 | $157,786 | $1,489,670 | $508,500 | $981,170 |
| 2023 | $156,347 | $1,476,090 | $508,500 | $967,590 |
| 2022 | $149,945 | $1,746,900 | $508,500 | $1,238,400 |
| 2021 | $115,351 | $1,078,650 | $508,500 | $570,150 |
| 2020 | $141,064 | $1,418,400 | $508,500 | $909,900 |
| 2019 | $135,940 | $1,383,300 | $508,500 | $874,800 |
| 2018 | $130,215 | $1,238,490 | $508,500 | $729,990 |
| 2017 | $124,868 | $1,187,640 | $508,500 | $679,140 |
| 2016 | $121,070 | $1,187,640 | $508,500 | $679,140 |
| 2015 | $54,889 | $1,195,830 | $508,500 | $687,330 |
| 2014 | $54,889 | $1,217,160 | $508,500 | $708,660 |
Source: Public Records
Map
Nearby Homes
- 8518 65th Rd
- 85-18 65th Rd
- 6419 Fitchett St
- 65-19 Dieterle Crescent
- 63-88 Woodhaven Blvd
- 85-76 66th Rd
- 63-93 Woodhaven Blvd Unit 2F3
- 63-127 Fitchett St
- 85-82 66th Rd
- 84-52 Fleet Ct
- 6472 84th St
- 64-83 83rd Place
- 6515 Alderton St Unit 3B
- 6515 Alderton St Unit 2A
- 65-11 Alderton St
- 8545 67th Dr
- 65-15 Alderton St Unit 5E
- 65-15 Alderton St Unit 5F
- 65-15 Alderton St Unit 2c
- 65-15 Alderton St Unit 1A