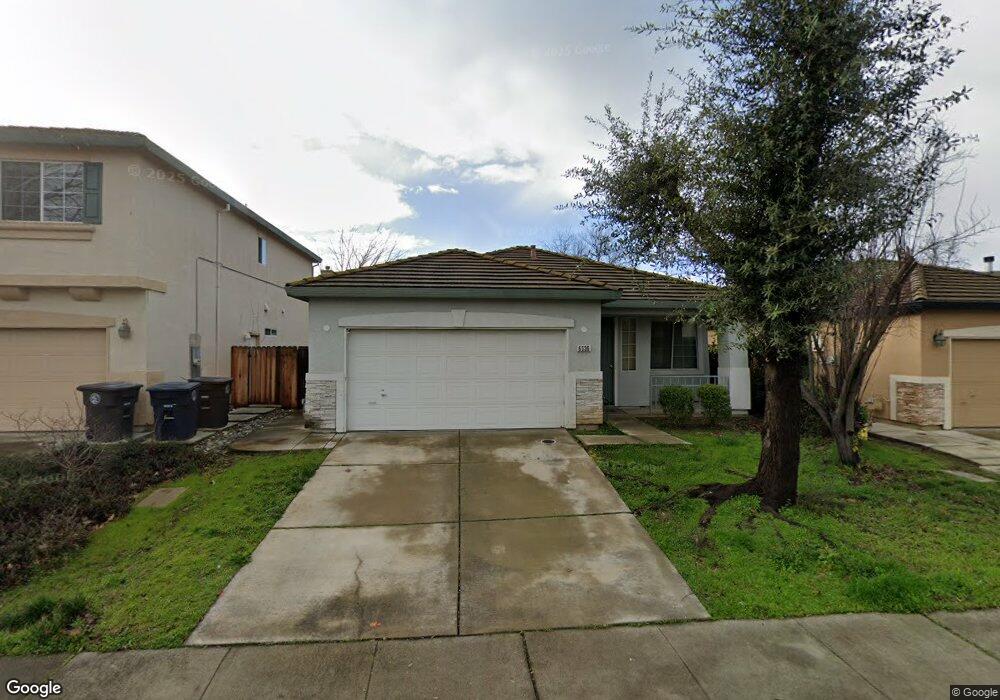
6536 Ranch Hand Way Citrus Heights, CA 95621
Estimated Value: $372,000 - $499,000
3
Beds
2
Baths
1,527
Sq Ft
$299/Sq Ft
Est. Value
About This Home
This home is located at 6536 Ranch Hand Way, Citrus Heights, CA 95621 and is currently estimated at $456,697, approximately $299 per square foot. 6536 Ranch Hand Way is a home located in Sacramento County with nearby schools including Arlington Heights Elementary School, Sylvan Middle School, and Mesa Verde High School.
Ownership History
Date
Name
Owned For
Owner Type
Purchase Details
Closed on
Aug 14, 2004
Sold by
Truong Mai Thanh Thi and Truong Mai Thanh
Bought by
Truong Mai Thanh Thi
Current Estimated Value
Home Financials for this Owner
Home Financials are based on the most recent Mortgage that was taken out on this home.
Original Mortgage
$228,700
Outstanding Balance
$77,131
Interest Rate
1.25%
Mortgage Type
Negative Amortization
Estimated Equity
$379,566
Purchase Details
Closed on
Jan 4, 2001
Sold by
Kaufman & Broad Of Sacramento Inc
Bought by
Truong Mai Thanh
Home Financials for this Owner
Home Financials are based on the most recent Mortgage that was taken out on this home.
Original Mortgage
$158,937
Interest Rate
7.71%
Mortgage Type
Stand Alone First
Create a Home Valuation Report for This Property
The Home Valuation Report is an in-depth analysis detailing your home's value as well as a comparison with similar homes in the area
Home Values in the Area
Average Home Value in this Area
Purchase History
| Date | Buyer | Sale Price | Title Company |
|---|---|---|---|
| Truong Mai Thanh Thi | -- | Alliance Title Company | |
| Truong Mai Thanh | $170,000 | First American Title Co |
Source: Public Records
Mortgage History
| Date | Status | Borrower | Loan Amount |
|---|---|---|---|
| Open | Truong Mai Thanh Thi | $228,700 | |
| Previous Owner | Truong Mai Thanh | $158,937 |
Source: Public Records
Tax History Compared to Growth
Tax History
| Year | Tax Paid | Tax Assessment Tax Assessment Total Assessment is a certain percentage of the fair market value that is determined by local assessors to be the total taxable value of land and additions on the property. | Land | Improvement |
|---|---|---|---|---|
| 2025 | $3,143 | $255,448 | $60,260 | $195,188 |
| 2024 | $3,143 | $250,440 | $59,079 | $191,361 |
| 2023 | $3,064 | $245,530 | $57,921 | $187,609 |
| 2022 | $3,045 | $240,717 | $56,786 | $183,931 |
| 2021 | $2,994 | $235,998 | $55,673 | $180,325 |
| 2020 | $2,940 | $233,579 | $55,103 | $178,476 |
| 2019 | $2,884 | $229,000 | $54,023 | $174,977 |
| 2018 | $2,852 | $224,511 | $52,964 | $171,547 |
| 2017 | $2,825 | $220,110 | $51,926 | $168,184 |
| 2016 | $2,647 | $215,795 | $50,908 | $164,887 |
| 2015 | $2,604 | $212,555 | $50,144 | $162,411 |
| 2014 | $2,552 | $208,392 | $49,162 | $159,230 |
Source: Public Records
Map
Nearby Homes
- 6608 Trailride Way
- 6912 van Maren Ln
- 6937 Grand Tree Ln
- 7101 van Maren Ln
- 6829 Kittery Ave
- 6327 Westbrook Dr
- 6709 Alden Ln
- 6717 Alden Ln
- 6917 Vera Cruz Ct
- 6862 Westchester Way
- 6336 Twin Wood Way
- 7105 Ansley Ct
- 6923 Daisy Ln
- 6616 Silver Springs Ct
- 6543 Crosswoods Cir
- 6325 Wexford Cir
- 6914 San Angelo Ct
- 7032 Sunburst Way
- 6941 Radiance Cir
- 6105 Meiggs Ct Unit 1015
- 6532 Ranch Hand Way
- 6540 Ranch Hand Way
- 6528 Ranch Hand Way
- 6541 Cowboy Way
- 6537 Cowboy Way
- 6545 Cowboy Way
- 6524 Ranch Hand Way
- 6533 Cowboy Way
- 6537 Ranch Hand Way
- 6533 Ranch Hand Way
- 6541 Ranch Hand Way
- 6529 Cowboy Way
- 6529 Ranch Hand Way
- 6812 Ranch House Way
- 6808 Ranch House Way
- 6520 Ranch Hand Way
- 6816 Ranch House Way
- 6804 Ranch House Way
- 6820 Ranch House Way
- 6525 Ranch Hand Way