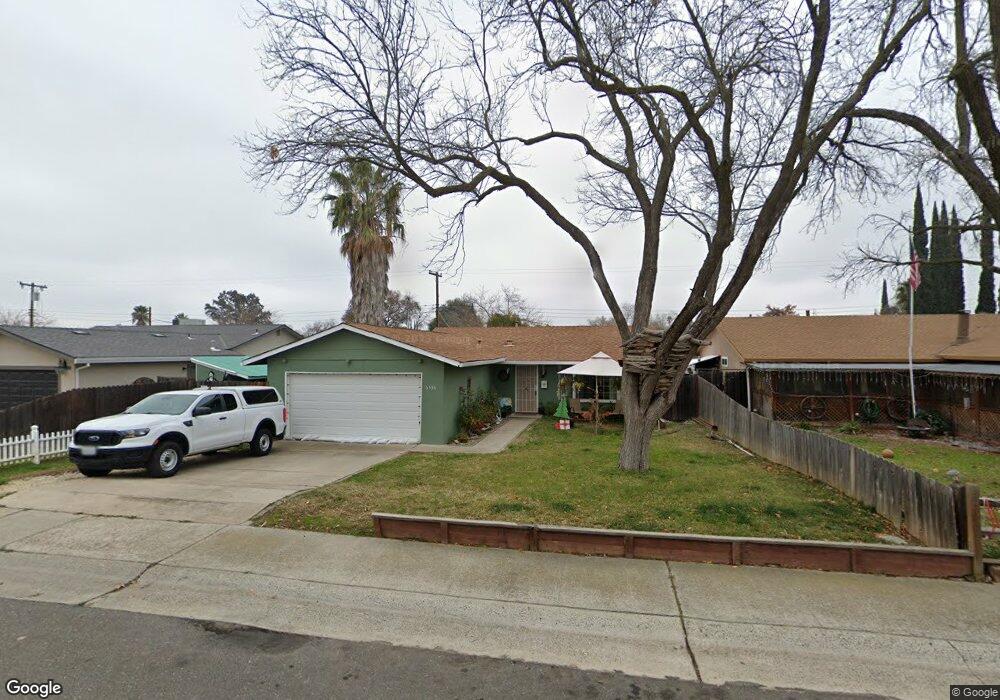
6536 Viscount Way Citrus Heights, CA 95621
Estimated Value: $139,000 - $369,000
2
Beds
1
Bath
875
Sq Ft
$350/Sq Ft
Est. Value
About This Home
This home is located at 6536 Viscount Way, Citrus Heights, CA 95621 and is currently estimated at $306,225, approximately $349 per square foot. 6536 Viscount Way is a home located in Sacramento County with nearby schools including Lichen K-8, Mesa Verde High School, and Valley Christian Academy.
Ownership History
Date
Name
Owned For
Owner Type
Purchase Details
Closed on
Aug 8, 2008
Sold by
Delosantos Rosalia and Delosantos Juan
Bought by
Osullivan Cynthia L
Current Estimated Value
Home Financials for this Owner
Home Financials are based on the most recent Mortgage that was taken out on this home.
Original Mortgage
$95,000
Outstanding Balance
$62,320
Interest Rate
6.32%
Mortgage Type
Purchase Money Mortgage
Estimated Equity
$243,905
Purchase Details
Closed on
Jan 18, 2006
Sold by
Pope Robert
Bought by
Delosantos Juana and Delosantos Rosalia
Home Financials for this Owner
Home Financials are based on the most recent Mortgage that was taken out on this home.
Original Mortgage
$232,000
Interest Rate
7.15%
Mortgage Type
Purchase Money Mortgage
Purchase Details
Closed on
Apr 25, 2002
Sold by
Conover Kenneth B
Bought by
Pope Robert
Home Financials for this Owner
Home Financials are based on the most recent Mortgage that was taken out on this home.
Original Mortgage
$93,750
Interest Rate
7.62%
Create a Home Valuation Report for This Property
The Home Valuation Report is an in-depth analysis detailing your home's value as well as a comparison with similar homes in the area
Home Values in the Area
Average Home Value in this Area
Purchase History
| Date | Buyer | Sale Price | Title Company |
|---|---|---|---|
| Osullivan Cynthia L | $131,000 | Placer Title Company | |
| Delosantos Juana | $290,000 | Placer Title Company | |
| Pope Robert | $125,000 | Stewart Title |
Source: Public Records
Mortgage History
| Date | Status | Borrower | Loan Amount |
|---|---|---|---|
| Open | Osullivan Cynthia L | $95,000 | |
| Previous Owner | Delosantos Juana | $232,000 | |
| Previous Owner | Pope Robert | $93,750 | |
| Closed | Pope Robert | $31,250 |
Source: Public Records
Tax History Compared to Growth
Tax History
| Year | Tax Paid | Tax Assessment Tax Assessment Total Assessment is a certain percentage of the fair market value that is determined by local assessors to be the total taxable value of land and additions on the property. | Land | Improvement |
|---|---|---|---|---|
| 2025 | $1,927 | $168,678 | $109,450 | $59,228 |
| 2024 | $1,927 | $165,371 | $107,304 | $58,067 |
| 2023 | $1,877 | $162,129 | $105,200 | $56,929 |
| 2022 | $1,865 | $158,951 | $103,138 | $55,813 |
| 2021 | $1,833 | $155,835 | $101,116 | $54,719 |
| 2020 | $1,798 | $154,238 | $100,080 | $54,158 |
| 2019 | $1,761 | $151,215 | $98,118 | $53,097 |
| 2018 | $1,739 | $148,251 | $96,195 | $52,056 |
| 2017 | $1,721 | $145,345 | $94,309 | $51,036 |
| 2016 | $1,607 | $142,496 | $92,460 | $50,036 |
| 2015 | $1,579 | $140,357 | $91,072 | $49,285 |
| 2014 | $1,545 | $137,609 | $89,289 | $48,320 |
Source: Public Records
Map
Nearby Homes
- 8256 Yardgate Way
- 8069 Cornerstone Way
- 8206 Lichen Dr
- 6428 Carmelwood Dr
- 6301 Autumn Oak Ct
- 7956 Brockwood Way
- 6611 Branchwater Way
- 6600 Branchwater Way
- 8001 Lichen Dr
- 230 Pau Hanna Cir Unit 230
- 266 Corto Ln Unit 266
- 256 Corto Ln
- 6112 Ledgewood Way
- 206 Pau Hana Cir
- 8424 Lost Cavern Ct
- 243 Pau Hana Cir
- 7716 Las Lilas Ct
- 187 Saxton Cir
- 8431 White Plains Ct
- 7128 Parish Way
- 6542 Viscount Way
- 6530 Viscount Way
- 8217 Yardgate Way
- 8225 Yardgate Way
- 6548 Viscount Way
- 6524 Viscount Way
- 8209 Yardgate Way
- 6537 Viscount Way
- 8233 Yardgate Way
- 6531 Viscount Way
- 6543 Viscount Way
- 6554 Viscount Way
- 6521 Viscount Way
- 6518 Viscount Way
- 8241 Yardgate Way
- 6549 Viscount Way
- 6549 Outlook Dr
- 6543 Outlook Dr
- 8216 Yardgate Way
- 6555 Viscount Way