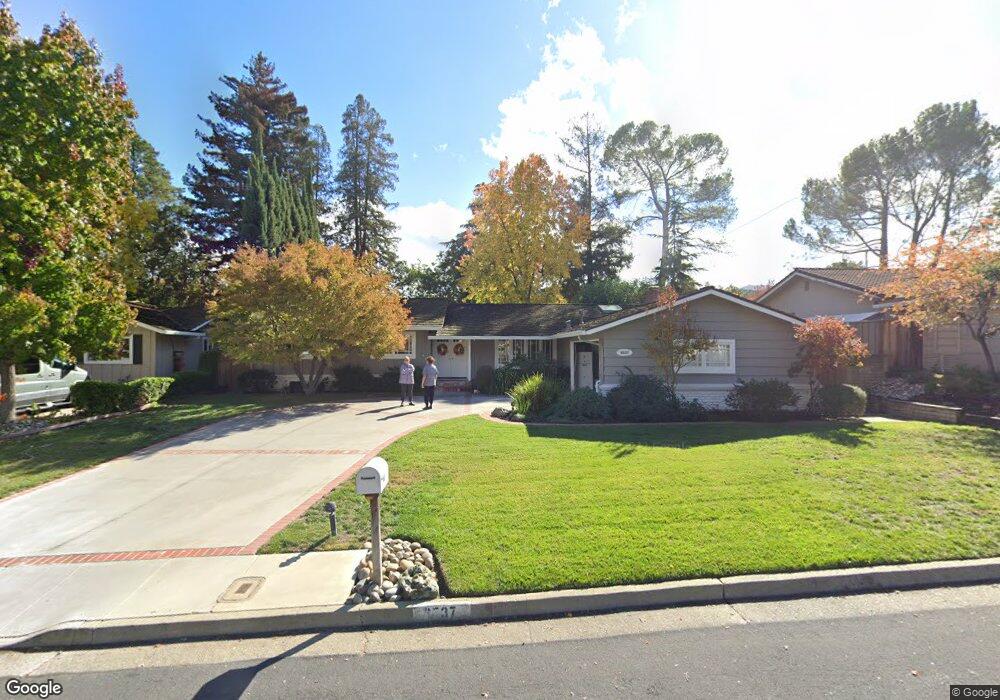
6537 Hampton Dr San Jose, CA 95120
Country Club NeighborhoodEstimated Value: $2,131,825 - $2,407,000
4
Beds
2
Baths
1,866
Sq Ft
$1,208/Sq Ft
Est. Value
About This Home
This home is located at 6537 Hampton Dr, San Jose, CA 95120 and is currently estimated at $2,253,456, approximately $1,207 per square foot. 6537 Hampton Dr is a home located in Santa Clara County with nearby schools including Simonds Elementary School, Castillero Middle School, and Leland High School.
Ownership History
Date
Name
Owned For
Owner Type
Purchase Details
Closed on
May 28, 2010
Sold by
Gulich Linda T
Bought by
Gulich Linda T
Current Estimated Value
Home Financials for this Owner
Home Financials are based on the most recent Mortgage that was taken out on this home.
Original Mortgage
$429,133
Outstanding Balance
$288,733
Interest Rate
5.05%
Mortgage Type
Seller Take Back
Estimated Equity
$1,964,723
Purchase Details
Closed on
Jul 29, 2009
Sold by
Gulich Timothy E and Gulich Linda T
Bought by
Gulich Timothy E and Gulich Linda T
Purchase Details
Closed on
Dec 9, 1993
Sold by
Serrano William W
Bought by
Gulich Timothy E and Gulich Linda T
Home Financials for this Owner
Home Financials are based on the most recent Mortgage that was taken out on this home.
Original Mortgage
$185,000
Interest Rate
7.09%
Create a Home Valuation Report for This Property
The Home Valuation Report is an in-depth analysis detailing your home's value as well as a comparison with similar homes in the area
Home Values in the Area
Average Home Value in this Area
Purchase History
| Date | Buyer | Sale Price | Title Company |
|---|---|---|---|
| Gulich Linda T | -- | None Available | |
| Gulich Timothy E | -- | None Available | |
| Gulich Timothy E | $313,000 | Old Republic Title Company |
Source: Public Records
Mortgage History
| Date | Status | Borrower | Loan Amount |
|---|---|---|---|
| Open | Gulich Linda T | $429,133 | |
| Closed | Gulich Timothy E | $185,000 |
Source: Public Records
Tax History
| Year | Tax Paid | Tax Assessment Tax Assessment Total Assessment is a certain percentage of the fair market value that is determined by local assessors to be the total taxable value of land and additions on the property. | Land | Improvement |
|---|---|---|---|---|
| 2025 | $7,606 | $534,530 | $212,444 | $322,086 |
| 2024 | $7,606 | $524,050 | $208,279 | $315,771 |
| 2023 | $7,437 | $513,776 | $204,196 | $309,580 |
| 2022 | $7,361 | $503,703 | $200,193 | $303,510 |
| 2021 | $7,176 | $493,827 | $196,268 | $297,559 |
| 2020 | $6,990 | $488,764 | $194,256 | $294,508 |
| 2019 | $6,825 | $479,182 | $190,448 | $288,734 |
| 2018 | $6,742 | $469,787 | $186,714 | $283,073 |
| 2017 | $6,679 | $460,576 | $183,053 | $277,523 |
| 2016 | $6,516 | $451,546 | $179,464 | $272,082 |
| 2015 | $6,465 | $444,765 | $176,769 | $267,996 |
| 2014 | $5,970 | $436,054 | $173,307 | $262,747 |
Source: Public Records
Map
Nearby Homes
- 1259 Hillcrest Dr
- 6690 Indian Springs Ct
- 6824 Leyland Park Dr
- 000 Box Canyon Rd
- 6512 Bose Ln
- 6834 Rockview Ct
- 6496 Sproul Ct
- 6617 Broadacres Dr
- 1182 Olive Branch Ln
- 6492 Hirabayashi Dr
- 6448 Menlo Dr
- 1156 Lansdale Ct
- 6380 Vegas Dr
- 7111 Echo Loop
- 6270 Tweedholm Ct
- 1113 Silver Oak Ct
- 6644 Mount Hope Dr
- 6281 Kelez Ct
- 1108 Holly Oak Cir
- 951 Wallace Dr
- 6543 Hampton Dr
- 6531 Hampton Dr
- 1265 Hillcrest Dr
- 6666 Camelia Dr
- 6547 Hampton Dr
- 6532 Hampton Dr
- 6544 Hampton Dr
- 1257 Hillcrest Dr
- 6665 Camelia Dr
- 6657 Camelia Dr
- 6618 Camelia Dr
- 1271 Hillcrest Dr
- 6649 Camelia Dr
- 1266 Hillcrest Dr
- 6559 Hampton Dr
- 6558 Hampton Dr
- 1262 Hillcrest Dr
- 6641 Camelia Dr
- 1270 Hillcrest Dr
- 6633 Camelia Dr
Your Personal Tour Guide
Ask me questions while you tour the home.