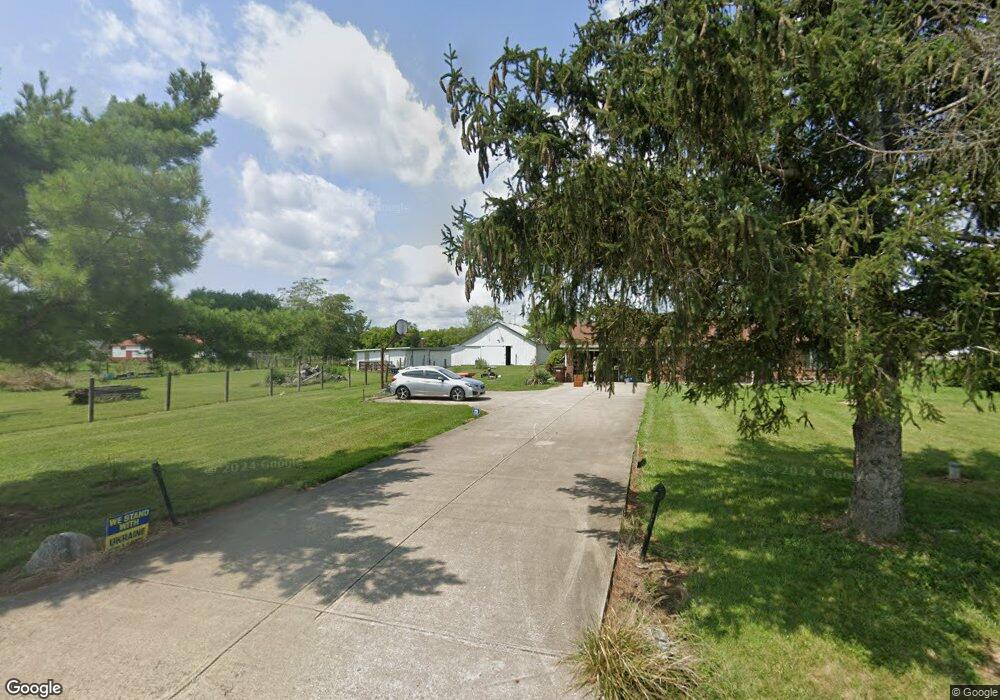
6539 Moses Rd West Alexandria, OH 45381
Estimated Value: $208,000 - $311,000
3
Beds
2
Baths
1,097
Sq Ft
$248/Sq Ft
Est. Value
About This Home
This home is located at 6539 Moses Rd, West Alexandria, OH 45381 and is currently estimated at $271,782, approximately $247 per square foot. 6539 Moses Rd is a home located in Preble County with nearby schools including Twin Valley South Elementary School, Twin Valley South Middle School, and Twin Valley South High School.
Ownership History
Date
Name
Owned For
Owner Type
Purchase Details
Closed on
Feb 5, 2008
Sold by
Gonnella Gabrielle D
Bought by
Gonnella James G
Current Estimated Value
Purchase Details
Closed on
Jul 19, 1994
Sold by
Stamper Glenn
Bought by
Gonnella James G and Gonnella Gabriella D
Home Financials for this Owner
Home Financials are based on the most recent Mortgage that was taken out on this home.
Original Mortgage
$86,400
Interest Rate
8.6%
Mortgage Type
New Conventional
Create a Home Valuation Report for This Property
The Home Valuation Report is an in-depth analysis detailing your home's value as well as a comparison with similar homes in the area
Home Values in the Area
Average Home Value in this Area
Purchase History
| Date | Buyer | Sale Price | Title Company |
|---|---|---|---|
| Gonnella James G | -- | None Available | |
| Gonnella James G | $96,000 | -- |
Source: Public Records
Mortgage History
| Date | Status | Borrower | Loan Amount |
|---|---|---|---|
| Previous Owner | Gonnella James G | $86,400 |
Source: Public Records
Tax History Compared to Growth
Tax History
| Year | Tax Paid | Tax Assessment Tax Assessment Total Assessment is a certain percentage of the fair market value that is determined by local assessors to be the total taxable value of land and additions on the property. | Land | Improvement |
|---|---|---|---|---|
| 2024 | $2,300 | $65,910 | $20,440 | $45,470 |
| 2023 | $2,300 | $65,910 | $20,440 | $45,470 |
| 2022 | $1,974 | $53,520 | $19,180 | $34,340 |
| 2021 | $2,139 | $53,520 | $19,180 | $34,340 |
| 2020 | $2,049 | $53,520 | $19,180 | $34,340 |
| 2019 | $1,752 | $44,560 | $16,000 | $28,560 |
| 2018 | $1,813 | $44,560 | $16,000 | $28,560 |
| 2017 | $1,709 | $44,560 | $16,000 | $28,560 |
| 2016 | $1,530 | $41,510 | $15,540 | $25,970 |
| 2014 | $1,513 | $41,510 | $15,540 | $25,970 |
| 2013 | $1,721 | $43,715 | $15,540 | $28,175 |
Source: Public Records
Map
Nearby Homes
- 3292 Twin Creek Rd
- 4801 Fisher Twin Rd
- 15600 Dechant Rd
- 1389 Leon Dr
- 6762 U S 35
- 60 Hope Ave
- 0 State Rt 35 Unit 935251
- 37 Smith St
- 52 E 2nd St
- 0 U S 35
- 36 E 3rd St
- 212 E 3rd St
- 10 Western Dr
- 1020 Howard Ct
- 1111 Bull Rd
- 3659 Winston Ln
- 205 Ada Doty St
- 14541 Lower Gratis Rd
- 3993 Farmersville W Alex Rd
- 54 Apple Dr