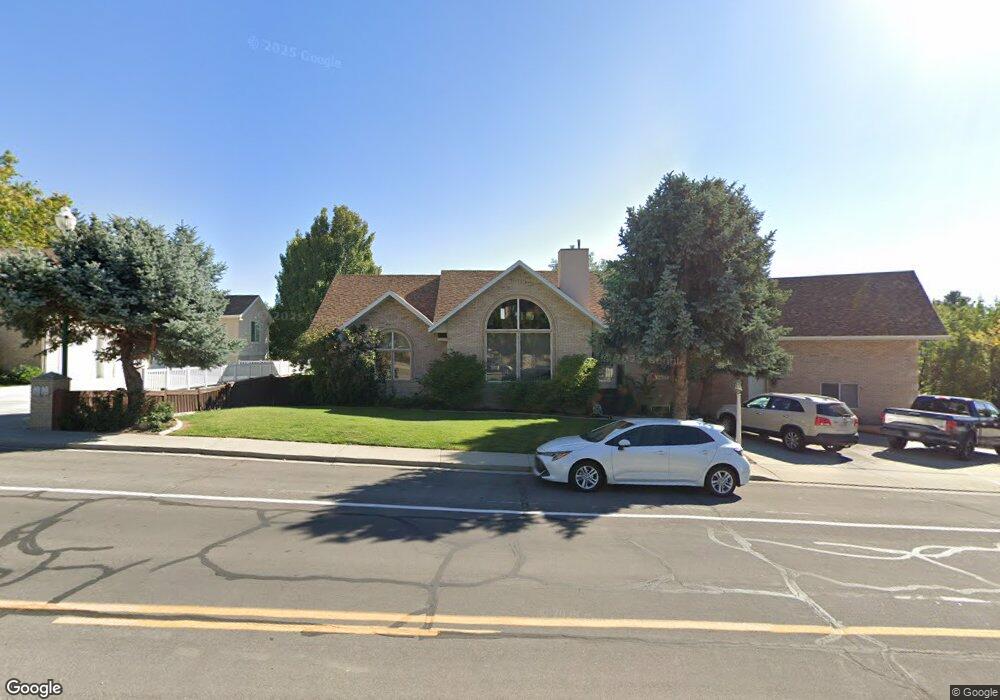
654 E 2000 N Orem, UT 84097
Northridge NeighborhoodEstimated Value: $802,000 - $998,000
4
Beds
3
Baths
4,716
Sq Ft
$196/Sq Ft
Est. Value
About This Home
This home is located at 654 E 2000 N, Orem, UT 84097 and is currently estimated at $923,832, approximately $195 per square foot. 654 E 2000 N is a home located in Utah County with nearby schools including Orchard Elementary School, Oak Canyon Junior High School, and Timpanogos High School.
Ownership History
Date
Name
Owned For
Owner Type
Purchase Details
Closed on
Nov 27, 2017
Sold by
Anderson Vincent Scott
Bought by
Anderson Vincent Scott and Anderson Shauna R
Current Estimated Value
Home Financials for this Owner
Home Financials are based on the most recent Mortgage that was taken out on this home.
Original Mortgage
$400,000
Outstanding Balance
$336,765
Interest Rate
3.94%
Mortgage Type
New Conventional
Estimated Equity
$587,067
Purchase Details
Closed on
Dec 20, 2012
Sold by
Dickerson Linda
Bought by
Anderson Vincent S and Anderson Shauna R
Home Financials for this Owner
Home Financials are based on the most recent Mortgage that was taken out on this home.
Original Mortgage
$345,420
Interest Rate
3.27%
Mortgage Type
New Conventional
Create a Home Valuation Report for This Property
The Home Valuation Report is an in-depth analysis detailing your home's value as well as a comparison with similar homes in the area
Home Values in the Area
Average Home Value in this Area
Purchase History
| Date | Buyer | Sale Price | Title Company |
|---|---|---|---|
| Anderson Vincent Scott | -- | Utah First Title Ins Agency | |
| Anderson Vincent Scott | -- | Utah First Title Ins Agency | |
| Anderson Vincent S | -- | Union Title |
Source: Public Records
Mortgage History
| Date | Status | Borrower | Loan Amount |
|---|---|---|---|
| Open | Anderson Vincent Scott | $400,000 | |
| Closed | Anderson Vincent S | $345,420 |
Source: Public Records
Tax History
| Year | Tax Paid | Tax Assessment Tax Assessment Total Assessment is a certain percentage of the fair market value that is determined by local assessors to be the total taxable value of land and additions on the property. | Land | Improvement |
|---|---|---|---|---|
| 2025 | $3,402 | $473,110 | -- | -- |
| 2024 | $3,402 | $416,020 | $0 | $0 |
| 2023 | $3,236 | $425,315 | $0 | $0 |
| 2022 | $3,584 | $456,280 | $0 | $0 |
| 2021 | $3,259 | $628,400 | $210,300 | $418,100 |
| 2020 | $3,066 | $581,100 | $182,900 | $398,200 |
| 2019 | $2,689 | $530,000 | $170,100 | $359,900 |
| 2018 | $2,726 | $513,400 | $170,100 | $343,300 |
| 2017 | $2,548 | $257,070 | $0 | $0 |
| 2016 | $2,651 | $246,620 | $0 | $0 |
| 2015 | $2,803 | $246,620 | $0 | $0 |
| 2014 | $2,507 | $219,505 | $0 | $0 |
Source: Public Records
Map
Nearby Homes
- 1768 Moor Ln
- 1643 N Mountain Oaks Dr
- 1051 E 100 N
- 193 E 1570 N
- 713 E 1500 St N Unit 19
- 713 E 1450 N Unit 23
- 1366 N 750 E Unit LOT 12
- 1356 N 750 E Unit 11
- 363 E 1395 N Unit 22
- 733 E 1450 N Unit 5
- 1324 N 750 E Unit 3
- 1371 N 330 E Unit 8
- 700 E 1280 N
- 687 E 175 N
- 318 E 1250 N
- 681 E 215 N
- 790 E 400 N
- 87 W 1525 N
- 372 E 1165 N
- 1547 N 275 West St Unit 5