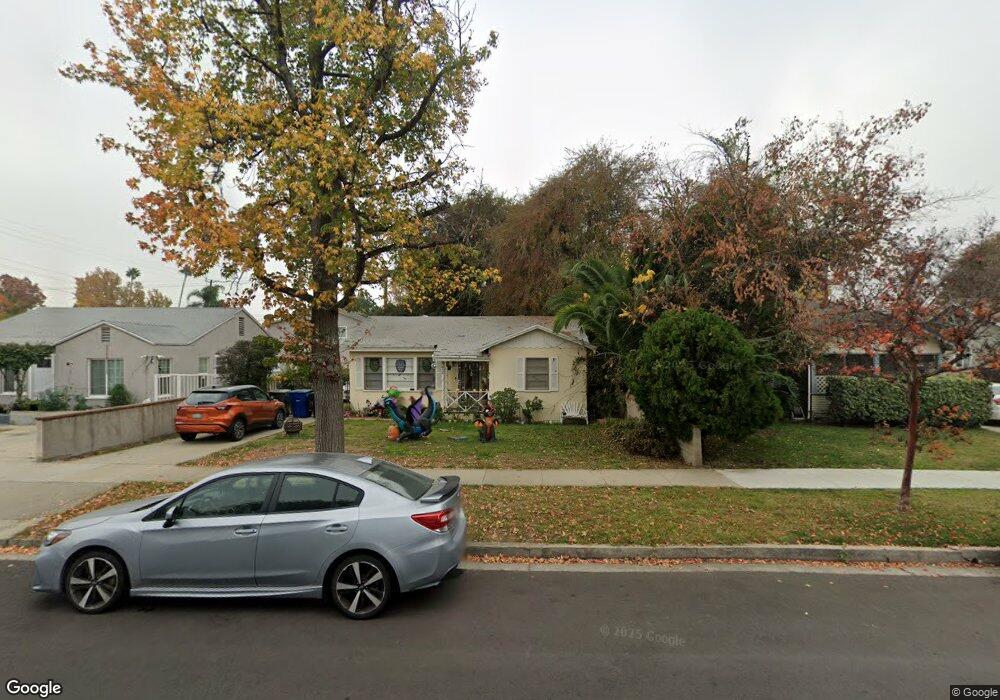
654 E I St Ontario, CA 91764
Downtown Ontario NeighborhoodEstimated Value: $530,664 - $627,000
2
Beds
1
Bath
897
Sq Ft
$644/Sq Ft
Est. Value
About This Home
This home is located at 654 E I St, Ontario, CA 91764 and is currently estimated at $577,666, approximately $643 per square foot. 654 E I St is a home located in San Bernardino County with nearby schools including Central Language Academy, Vina Danks Middle, and Chaffey High School.
Ownership History
Date
Name
Owned For
Owner Type
Purchase Details
Closed on
Dec 9, 2021
Sold by
Lawrence A Wedell 2017 Living Trust and Bromley Mary Linda
Bought by
Wedell Ann Mary
Current Estimated Value
Purchase Details
Closed on
Feb 23, 2021
Sold by
Wedell Lawrence A
Bought by
Mary Linda Bromley Trust and Bromley
Purchase Details
Closed on
Dec 21, 2020
Sold by
Lawrence A Wedell 2017 Living Trust and Bromley Mary Linda
Bought by
Bromley Mary Linda
Purchase Details
Closed on
Aug 15, 2017
Sold by
Wedell Lawrence A
Bought by
Wedell Lawrence A and The Lawrence A Wedell 2017 Liv
Create a Home Valuation Report for This Property
The Home Valuation Report is an in-depth analysis detailing your home's value as well as a comparison with similar homes in the area
Home Values in the Area
Average Home Value in this Area
Purchase History
| Date | Buyer | Sale Price | Title Company |
|---|---|---|---|
| Wedell Ann Mary | -- | None Listed On Document | |
| Mary Linda Bromley Trust | -- | -- | |
| Bromley Mary Linda | -- | None Listed On Document | |
| Wedell Lawrence A | -- | None Available |
Source: Public Records
Tax History
| Year | Tax Paid | Tax Assessment Tax Assessment Total Assessment is a certain percentage of the fair market value that is determined by local assessors to be the total taxable value of land and additions on the property. | Land | Improvement |
|---|---|---|---|---|
| 2025 | $1,281 | $114,849 | $47,851 | $66,998 |
| 2024 | $1,252 | $112,597 | $46,913 | $65,684 |
| 2023 | $1,217 | $110,389 | $45,993 | $64,396 |
| 2022 | $1,201 | $108,224 | $45,091 | $63,133 |
| 2021 | $1,193 | $106,102 | $44,207 | $61,895 |
| 2020 | $1,172 | $105,014 | $43,754 | $61,260 |
| 2019 | $1,162 | $102,955 | $42,896 | $60,059 |
| 2018 | $1,146 | $100,936 | $42,055 | $58,881 |
| 2017 | $1,105 | $98,956 | $41,230 | $57,726 |
| 2016 | $1,062 | $97,016 | $40,422 | $56,594 |
| 2015 | $1,055 | $95,559 | $39,815 | $55,744 |
| 2014 | $1,022 | $93,687 | $39,035 | $54,652 |
Source: Public Records
Map
Nearby Homes
Your Personal Tour Guide
Ask me questions while you tour the home.