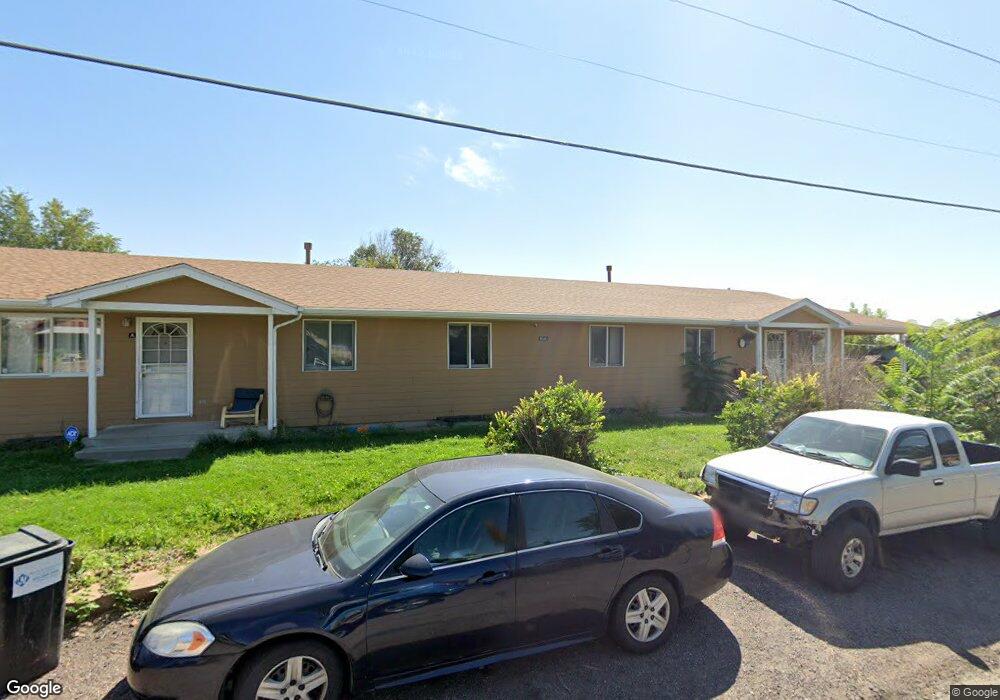
6540C Clay St Unit D Denver, CO 80221
Berkley NeighborhoodEstimated Value: $712,000 - $782,968
8
Beds
4
Baths
2,400
Sq Ft
$307/Sq Ft
Est. Value
About This Home
This home is located at 6540C Clay St Unit D, Denver, CO 80221 and is currently estimated at $736,656, approximately $306 per square foot. 6540C Clay St Unit D is a home located in Adams County with nearby schools including Colorado Sports Leadership Academy, Westminster High School, and Midtown Montessori Academy.
Ownership History
Date
Name
Owned For
Owner Type
Purchase Details
Closed on
Dec 15, 2020
Sold by
Denison Real Estate & Investment Llc
Bought by
Muldoon Caitlin
Current Estimated Value
Purchase Details
Closed on
Sep 14, 2018
Sold by
Ramos Rosemary
Bought by
Muldoon Caitlin
Home Financials for this Owner
Home Financials are based on the most recent Mortgage that was taken out on this home.
Original Mortgage
$505,672
Interest Rate
4.6%
Mortgage Type
FHA
Purchase Details
Closed on
May 24, 1996
Sold by
Olivas Gregory K and Olivas Rosemary
Bought by
Olivas Gregory K and Olivas Rosemary
Home Financials for this Owner
Home Financials are based on the most recent Mortgage that was taken out on this home.
Original Mortgage
$129,500
Interest Rate
7.93%
Mortgage Type
Purchase Money Mortgage
Create a Home Valuation Report for This Property
The Home Valuation Report is an in-depth analysis detailing your home's value as well as a comparison with similar homes in the area
Home Values in the Area
Average Home Value in this Area
Purchase History
| Date | Buyer | Sale Price | Title Company |
|---|---|---|---|
| Muldoon Caitlin | -- | None Listed On Document | |
| Muldoon Caitlin | $515,000 | Land Title Guarantee Co | |
| Olivas Gregory K | -- | -- |
Source: Public Records
Mortgage History
| Date | Status | Borrower | Loan Amount |
|---|---|---|---|
| Previous Owner | Muldoon Caitlin | $505,672 | |
| Previous Owner | Olivas Gregory K | $129,500 |
Source: Public Records
Tax History Compared to Growth
Tax History
| Year | Tax Paid | Tax Assessment Tax Assessment Total Assessment is a certain percentage of the fair market value that is determined by local assessors to be the total taxable value of land and additions on the property. | Land | Improvement |
|---|---|---|---|---|
| 2024 | $5,694 | $54,250 | $8,160 | $46,090 |
| 2023 | $5,661 | $59,190 | $7,100 | $52,090 |
| 2022 | $5,036 | $41,120 | $7,140 | $33,980 |
| 2021 | $5,251 | $41,120 | $7,140 | $33,980 |
| 2020 | $3,969 | $32,310 | $7,510 | $24,800 |
| 2019 | $3,955 | $32,310 | $7,510 | $24,800 |
| 2018 | $2,961 | $23,910 | $6,480 | $17,430 |
| 2017 | $2,596 | $23,910 | $6,480 | $17,430 |
| 2016 | $2,401 | $20,880 | $3,340 | $17,540 |
| 2015 | $2,396 | $20,880 | $3,340 | $17,540 |
| 2014 | -- | $16,300 | $2,990 | $13,310 |
Source: Public Records
Map
Nearby Homes
- 6550 Clay St Unit B
- 6550 Clay St Unit A
- 2870 W 67th Place
- 0 Federal Blvd
- 6673 Fern Dr
- 2676 W 68th Ave
- 2736 W 68th Ave
- 2740 W 68th Ave
- 3090 W Hawthorne Place
- 3085 W 64th Ave
- 2658 W 68th Ave
- Kennedy 1 Plan at Westminster Station - Townhomes
- Kennedy Plan at Westminster Station - Townhomes
- Preston Plan at Westminster Station - Townhomes
- Preston 1 Plan at Westminster Station - Townhomes
- 6860 Zuni Ct
- Horizon Four Plan at Midtown - Horizon Townhomes Portfolio
- Horizon Five Plan at Midtown - Horizon Townhomes Portfolio
- Horizon Two Plan at Midtown - Horizon Townhomes Portfolio
- 2475 W 69th Place
- 6540 Clay St
- 6540 Clay St Unit A-B
- 6540 A & B Clay St
- 2668 W 65th Place Unit 2668
- 6550 Clay St Unit A
- 6520 Clay St
- 2666 W 65th Place Unit 2666
- 2664 W 65th Place
- 2662 W 65th Place Unit 2662
- 6531 Clay St
- 2660 W 65th Place
- 2658 W 65th Place
- 2656 W 65th Place
- 2654 W 65th Place
- 2585 W 65th Ave
- 2652 W 65th Place
- 2650 W 65th Place
- 2700 W 65th Place
- 2575 W 65th Ave
- 6502 Clay St