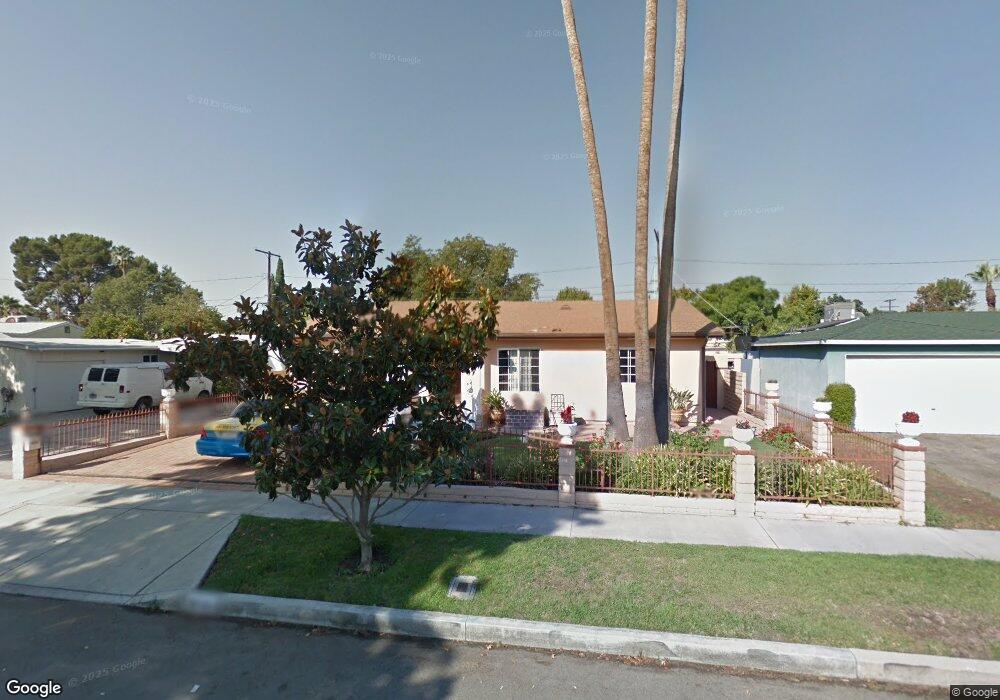
6541 Longridge Ave van Nuys, CA 91401
Estimated Value: $915,000 - $1,241,000
4
Beds
3
Baths
1,962
Sq Ft
$559/Sq Ft
Est. Value
About This Home
This home is located at 6541 Longridge Ave, van Nuys, CA 91401 and is currently estimated at $1,096,842, approximately $559 per square foot. 6541 Longridge Ave is a home located in Los Angeles County with nearby schools including Kittridge Street Elementary, James Madison Middle, and Ulysses S. Grant Senior High School.
Ownership History
Date
Name
Owned For
Owner Type
Purchase Details
Closed on
Mar 28, 2011
Sold by
Mucetti Rosa and Mucetti Rosa E
Bought by
Hovhannisyan Edgar
Current Estimated Value
Home Financials for this Owner
Home Financials are based on the most recent Mortgage that was taken out on this home.
Original Mortgage
$389,759
Outstanding Balance
$255,326
Interest Rate
3.75%
Mortgage Type
FHA
Estimated Equity
$822,681
Purchase Details
Closed on
Jun 1, 2004
Sold by
Mucetti Pascual and Mucetti Rosa E
Bought by
Mucetti Pascual
Home Financials for this Owner
Home Financials are based on the most recent Mortgage that was taken out on this home.
Original Mortgage
$135,000
Interest Rate
5.99%
Mortgage Type
New Conventional
Purchase Details
Closed on
Aug 25, 1997
Sold by
Clerk U S District Court
Bought by
Mucetti Pascual
Create a Home Valuation Report for This Property
The Home Valuation Report is an in-depth analysis detailing your home's value as well as a comparison with similar homes in the area
Home Values in the Area
Average Home Value in this Area
Purchase History
| Date | Buyer | Sale Price | Title Company |
|---|---|---|---|
| Hovhannisyan Edgar | $400,000 | Lawyers Title | |
| Mucetti Pascual | -- | Southland Title | |
| Mucetti Pascual | -- | -- |
Source: Public Records
Mortgage History
| Date | Status | Borrower | Loan Amount |
|---|---|---|---|
| Open | Hovhannisyan Edgar | $389,759 | |
| Previous Owner | Mucetti Pascual | $135,000 |
Source: Public Records
Tax History Compared to Growth
Tax History
| Year | Tax Paid | Tax Assessment Tax Assessment Total Assessment is a certain percentage of the fair market value that is determined by local assessors to be the total taxable value of land and additions on the property. | Land | Improvement |
|---|---|---|---|---|
| 2025 | $6,376 | $512,328 | $249,310 | $263,018 |
| 2024 | $6,376 | $502,283 | $244,422 | $257,861 |
| 2023 | $6,256 | $492,435 | $239,630 | $252,805 |
| 2022 | $5,970 | $482,781 | $234,932 | $247,849 |
| 2021 | $5,891 | $473,316 | $230,326 | $242,990 |
| 2019 | $5,718 | $459,280 | $223,496 | $235,784 |
| 2018 | $5,585 | $450,275 | $219,114 | $231,161 |
| 2016 | $5,325 | $432,792 | $210,606 | $222,186 |
| 2015 | $5,248 | $426,292 | $207,443 | $218,849 |
| 2014 | $5,271 | $417,943 | $203,380 | $214,563 |
Source: Public Records
Map
Nearby Homes
- 6535 Mary Ellen Ave
- 13226 Vanowen St
- 13350 Victory Blvd
- 6332 Fulton Ave Unit 109
- 6723 Sunnyslope Ave
- 6250 Fulton Ave Unit 104
- 6539 Ventura Canyon Ave
- 13061 Vanowen St
- 13127 Hartland St
- 13015 Vanowen St
- 12938 Vanowen St
- 13001 Debby St
- 6247 Morse Ave
- 6342 Morse Ave Unit 207
- 6342 Morse Ave Unit 205
- 6227 Morse Ave Unit 307
- 13455 Bassett St
- 6221 Morse Ave
- 13600 Sylvan St
- 6134 Longridge Ave
- 6535 Longridge Ave
- 6547 Longridge Ave
- 6529 Longridge Ave
- 6553 Longridge Ave
- 6542 Fulton Ave
- 6536 Fulton Ave
- 6548 Fulton Ave
- 6544 Longridge Ave
- 6538 Longridge Ave
- 6530 Fulton Ave
- 6523 Longridge Ave
- 6554 Fulton Ave
- 6552 Longridge Ave
- 6559 Longridge Ave
- 6532 Longridge Ave
- 6524 Fulton Ave
- 6524 Longridge Ave
- 6560 Fulton Ave
- 6517 Longridge Ave
- 6560 Longridge Ave