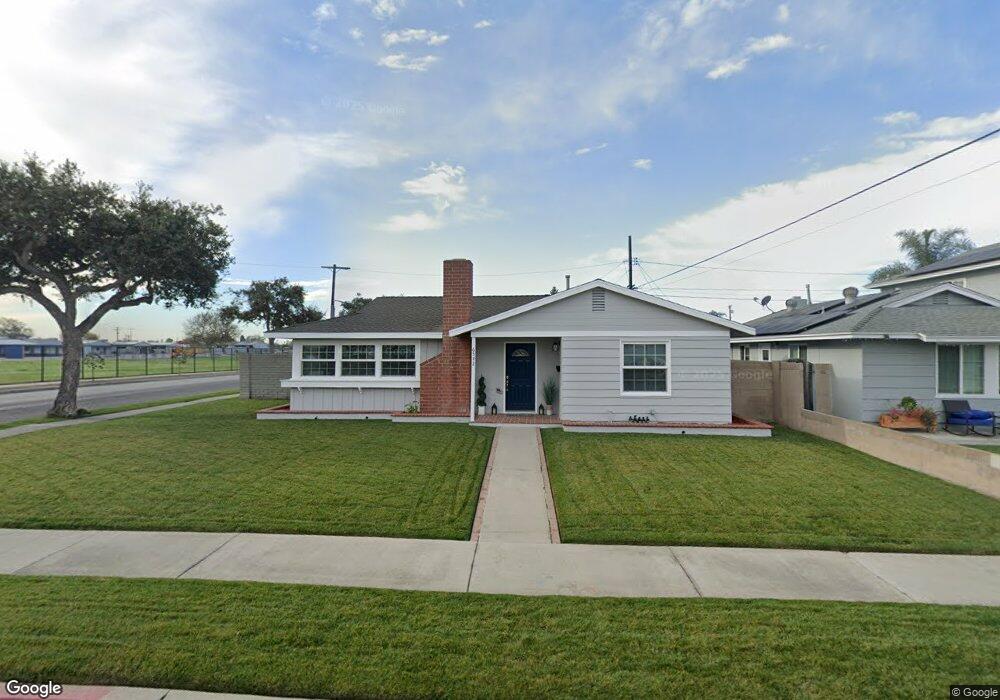
6542 San Diego Dr Buena Park, CA 90620
Estimated Value: $937,000 - $966,000
4
Beds
2
Baths
1,545
Sq Ft
$616/Sq Ft
Est. Value
About This Home
This home is located at 6542 San Diego Dr, Buena Park, CA 90620 and is currently estimated at $951,914, approximately $616 per square foot. 6542 San Diego Dr is a home located in Orange County with nearby schools including Buena Terra Elementary School, Walker Junior High School, and John F. Kennedy High School.
Ownership History
Date
Name
Owned For
Owner Type
Purchase Details
Closed on
Feb 25, 2008
Sold by
Citimortgage Inc
Bought by
Ontiveros Christine E
Current Estimated Value
Home Financials for this Owner
Home Financials are based on the most recent Mortgage that was taken out on this home.
Original Mortgage
$346,000
Outstanding Balance
$214,510
Interest Rate
5.65%
Mortgage Type
Purchase Money Mortgage
Estimated Equity
$737,404
Purchase Details
Closed on
Dec 15, 2007
Sold by
Harker Daniel G
Bought by
Citimortgage Inc
Purchase Details
Closed on
May 10, 2000
Sold by
Oliphant Brenda J and Oliphant Linda M
Bought by
Harker Daniel G
Home Financials for this Owner
Home Financials are based on the most recent Mortgage that was taken out on this home.
Original Mortgage
$221,176
Interest Rate
8.22%
Mortgage Type
FHA
Create a Home Valuation Report for This Property
The Home Valuation Report is an in-depth analysis detailing your home's value as well as a comparison with similar homes in the area
Home Values in the Area
Average Home Value in this Area
Purchase History
| Date | Buyer | Sale Price | Title Company |
|---|---|---|---|
| Ontiveros Christine E | -- | First American Title Ins Co | |
| Citimortgage Inc | $525,007 | First American Title Company | |
| Harker Daniel G | $223,000 | -- |
Source: Public Records
Mortgage History
| Date | Status | Borrower | Loan Amount |
|---|---|---|---|
| Open | Ontiveros Christine E | $346,000 | |
| Previous Owner | Harker Daniel G | $221,176 |
Source: Public Records
Tax History Compared to Growth
Tax History
| Year | Tax Paid | Tax Assessment Tax Assessment Total Assessment is a certain percentage of the fair market value that is determined by local assessors to be the total taxable value of land and additions on the property. | Land | Improvement |
|---|---|---|---|---|
| 2025 | $5,802 | $505,697 | $400,390 | $105,307 |
| 2024 | $5,802 | $495,782 | $392,539 | $103,243 |
| 2023 | $5,658 | $486,061 | $384,842 | $101,219 |
| 2022 | $5,586 | $476,531 | $377,296 | $99,235 |
| 2021 | $5,506 | $467,188 | $369,898 | $97,290 |
| 2020 | $5,474 | $462,398 | $366,105 | $96,293 |
| 2019 | $5,335 | $453,332 | $358,927 | $94,405 |
| 2018 | $5,238 | $444,444 | $351,890 | $92,554 |
| 2017 | $5,072 | $435,730 | $344,990 | $90,740 |
| 2016 | $4,974 | $427,187 | $338,226 | $88,961 |
| 2015 | $4,919 | $420,771 | $333,146 | $87,625 |
| 2014 | $4,670 | $412,529 | $326,620 | $85,909 |
Source: Public Records
Map
Nearby Homes
- 6191 San Ramon Way
- 7837 La Costa Cir
- 8072 San Hilario Cir
- 6932 San Joaquin Cir
- 6961 San Julian Cir
- 8456 San Clemente Way
- 6932 San Diego Dr
- 5837 Los Arcos Way
- 7571 San Rafael Dr
- 6601 Naomi Ave
- 7114 Santa Isabel Cir
- 5917 Crescent Ave
- 6893 San Bruno Dr
- 8214 Santa Inez Way
- 8623 Valley View St
- 6507 San Alano Cir
- 6996 Naomi Ave
- 8178 Santa Inez Dr
- 7531 Knott Ave
- 5835 Los Santos Way
- 6532 San Diego Dr
- 8142 San Miguel Cir
- 8132 San Miguel Cir
- 6522 San Diego Dr
- 6541 San Diego Dr
- 8122 San Miguel Cir
- 6512 San Diego Dr
- 6521 San Diego Dr
- 8112 San Marino Dr
- 8112 San Miguel Cir
- 8102 San Marino Dr
- 6511 San Diego Dr
- 6502 San Diego Dr
- 8141 San Miguel Cir
- 8071 San Marcello Cir
- 8131 San Miguel Cir
- 8061 San Marcello Cir
- 8102 San Miguel Cir
- 8121 San Miguel Cir
- 8131 San Dimas Cir