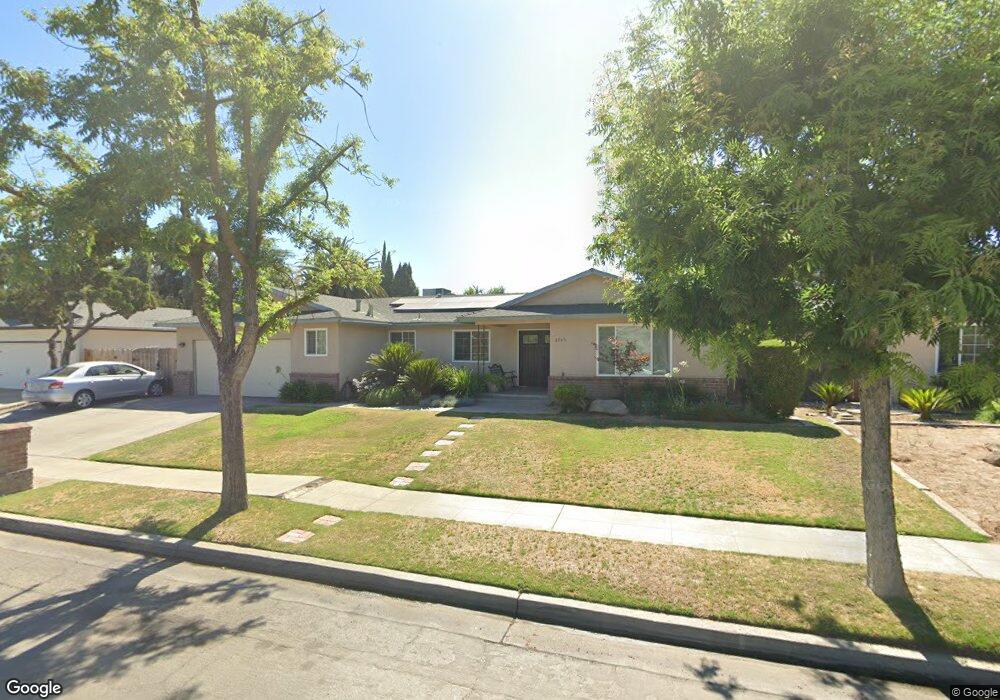
6545 N Channing Way Fresno, CA 93711
Bullard NeighborhoodEstimated Value: $502,000 - $556,000
5
Beds
3
Baths
2,484
Sq Ft
$214/Sq Ft
Est. Value
About This Home
This home is located at 6545 N Channing Way, Fresno, CA 93711 and is currently estimated at $531,674, approximately $214 per square foot. 6545 N Channing Way is a home located in Fresno County with nearby schools including Starr Elementary School, Tenaya Middle School, and Bullard High School.
Ownership History
Date
Name
Owned For
Owner Type
Purchase Details
Closed on
Sep 26, 2006
Sold by
Zaragoza Nina
Bought by
Zaragoza Nina and Garcia Rita
Current Estimated Value
Home Financials for this Owner
Home Financials are based on the most recent Mortgage that was taken out on this home.
Original Mortgage
$273,800
Outstanding Balance
$164,013
Interest Rate
6.53%
Mortgage Type
New Conventional
Estimated Equity
$367,661
Purchase Details
Closed on
Jan 11, 2005
Sold by
Zaragoza Michael
Bought by
Zaragoza Nina
Home Financials for this Owner
Home Financials are based on the most recent Mortgage that was taken out on this home.
Original Mortgage
$190,000
Interest Rate
5.69%
Mortgage Type
New Conventional
Purchase Details
Closed on
Jan 26, 1996
Sold by
Buttweiler Peter L and Buttweiler Mary Beth
Bought by
Zaragoza Michael and Zaragoza Nina
Home Financials for this Owner
Home Financials are based on the most recent Mortgage that was taken out on this home.
Original Mortgage
$105,215
Interest Rate
8.3%
Mortgage Type
FHA
Create a Home Valuation Report for This Property
The Home Valuation Report is an in-depth analysis detailing your home's value as well as a comparison with similar homes in the area
Home Values in the Area
Average Home Value in this Area
Purchase History
| Date | Buyer | Sale Price | Title Company |
|---|---|---|---|
| Zaragoza Nina | -- | First American Title Company | |
| Zaragoza Nina | -- | Fidelity National Title Co | |
| Zaragoza Michael | $106,000 | Commonwealth Land Title |
Source: Public Records
Mortgage History
| Date | Status | Borrower | Loan Amount |
|---|---|---|---|
| Open | Zaragoza Nina | $273,800 | |
| Closed | Zaragoza Nina | $190,000 | |
| Previous Owner | Zaragoza Michael | $105,215 |
Source: Public Records
Tax History Compared to Growth
Tax History
| Year | Tax Paid | Tax Assessment Tax Assessment Total Assessment is a certain percentage of the fair market value that is determined by local assessors to be the total taxable value of land and additions on the property. | Land | Improvement |
|---|---|---|---|---|
| 2025 | $4,694 | $347,729 | $79,135 | $268,594 |
| 2023 | $4,611 | $334,228 | $76,063 | $258,165 |
| 2022 | $4,553 | $327,675 | $74,572 | $253,103 |
| 2021 | $4,438 | $321,251 | $73,110 | $248,141 |
| 2020 | $4,410 | $317,958 | $72,361 | $245,597 |
| 2019 | $4,263 | $311,725 | $70,943 | $240,782 |
| 2018 | $4,178 | $305,613 | $69,552 | $236,061 |
| 2017 | $4,112 | $299,622 | $68,189 | $231,433 |
| 2016 | $3,988 | $293,748 | $66,852 | $226,896 |
| 2015 | $3,932 | $289,336 | $65,848 | $223,488 |
| 2014 | $3,863 | $283,670 | $64,559 | $219,111 |
Source: Public Records
Map
Nearby Homes
- 6569 N Teilman Ave
- 6671 N Channing Way
- 6753 N Durant Ave
- 6518 N Dolores Ave
- 1654 W Vartikian Ave
- 7047 N Teilman Ave Unit 101
- 7047 N Teilman Ave Unit 102
- 6743 N Dolores Ave
- 6447 N Vagedes Ave
- 1590 W Escalon Ave
- 2246 W Palo Alto Ave
- 1611 W Escalon Ave
- 6670 N Sequoia Ave
- 2284 W Palo Alto Ave
- 6660 N St Catherine Ct
- 1387 W Sample Ave
- 2290 W Atlanta Ave
- 6658 N Thorne Ave
- 2076 W Calimyrna Ave Unit 102
- 1709 W Calimyrna Ave Unit 9A
- 6557 N Channing Way
- 6533 N Channing Way
- 1703 W Palo Alto Ave
- 6521 N Channing Way
- 6569 N Channing Way
- 1666 W Los Altos Ave
- 1717 W Palo Alto Ave
- 1665 W Los Altos Ave
- 1667 W Palo Alto Ave
- 6509 N Channing Way
- 1652 W Los Altos Ave
- 1729 W Palo Alto Ave
- 1651 W Los Altos Ave
- 1655 W Palo Alto Ave
- 1660 W Paul Ave
- 1692 W Palo Alto Ave
- 6497 N Channing Way
- 1680 W Palo Alto Ave
- 1704 W Palo Alto Ave
- 1741 W Palo Alto Ave