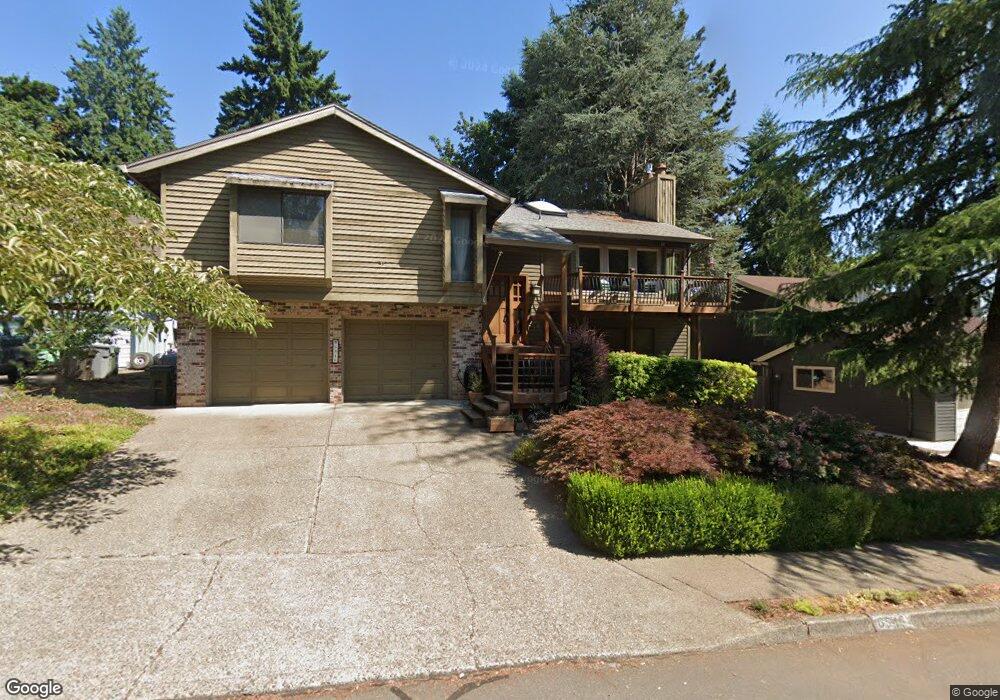
6546 Apollo Rd West Linn, OR 97068
Rosemont Summit NeighborhoodEstimated Value: $748,374 - $913,000
4
Beds
3
Baths
2,397
Sq Ft
$342/Sq Ft
Est. Value
About This Home
This home is located at 6546 Apollo Rd, West Linn, OR 97068 and is currently estimated at $819,094, approximately $341 per square foot. 6546 Apollo Rd is a home located in Clackamas County with nearby schools including Trillium Creek Primary School, Rosemont Ridge Middle School, and West Linn High School.
Ownership History
Date
Name
Owned For
Owner Type
Purchase Details
Closed on
May 10, 2023
Sold by
Ken & Mario M Shearmire Living Trust
Bought by
Ken & Mario Shearmire Living Trust
Current Estimated Value
Home Financials for this Owner
Home Financials are based on the most recent Mortgage that was taken out on this home.
Original Mortgage
$348,000
Outstanding Balance
$337,443
Interest Rate
6.32%
Mortgage Type
New Conventional
Estimated Equity
$481,651
Purchase Details
Closed on
Oct 8, 2017
Sold by
Shearmire Kenneth R and Shearmire Marlo M
Bought by
Shearmire Kenneth R and Shearmire Marlo M
Purchase Details
Closed on
Nov 25, 1997
Sold by
Keidel Joseph F and Keidel Karen L
Bought by
Shearmire Kenneth R and Shearmire Marlo M
Home Financials for this Owner
Home Financials are based on the most recent Mortgage that was taken out on this home.
Original Mortgage
$214,000
Interest Rate
6.75%
Create a Home Valuation Report for This Property
The Home Valuation Report is an in-depth analysis detailing your home's value as well as a comparison with similar homes in the area
Home Values in the Area
Average Home Value in this Area
Purchase History
| Date | Buyer | Sale Price | Title Company |
|---|---|---|---|
| Ken & Mario Shearmire Living Trust | -- | Fidelity National Title | |
| Shearmire Kenneth R | -- | None Available | |
| Shearmire Kenneth R | $238,000 | Ticor Title Insurance |
Source: Public Records
Mortgage History
| Date | Status | Borrower | Loan Amount |
|---|---|---|---|
| Open | Ken & Mario Shearmire Living Trust | $348,000 | |
| Previous Owner | Shearmire Kenneth R | $214,000 |
Source: Public Records
Tax History Compared to Growth
Tax History
| Year | Tax Paid | Tax Assessment Tax Assessment Total Assessment is a certain percentage of the fair market value that is determined by local assessors to be the total taxable value of land and additions on the property. | Land | Improvement |
|---|---|---|---|---|
| 2025 | $7,241 | $375,735 | -- | -- |
| 2024 | $6,970 | $364,792 | -- | -- |
| 2023 | $6,970 | $341,367 | $0 | $0 |
| 2022 | $6,341 | $331,425 | $0 | $0 |
| 2021 | $6,019 | $321,772 | $0 | $0 |
| 2020 | $6,053 | $312,400 | $0 | $0 |
| 2019 | $5,779 | $303,301 | $0 | $0 |
| 2018 | $5,520 | $294,467 | $0 | $0 |
| 2017 | $5,269 | $285,890 | $0 | $0 |
| 2016 | $5,051 | $277,563 | $0 | $0 |
| 2015 | $4,784 | $269,479 | $0 | $0 |
| 2014 | $4,523 | $261,630 | $0 | $0 |
Source: Public Records
Map
Nearby Homes
- 2583 Pimlico Dr
- 21065 Apollo Ct
- 4050 Serango Ct
- 6275 Clubhouse Cir
- 20120 Larkspur Ln Unit 85
- 2024 Conestoga Ln
- 2802 Tree Top Ln
- 20030 Marigold Ct Unit 15
- 2818 Treetop Ln
- 6233 Meridian Cir
- 3710 Mohawk Way
- 2700 Underhill Ln Unit 1
- 4057 Heron Dr
- 19788 Wildwood Dr
- 6135 Cheyenne Terrace
- 2488 Tulane St
- 19885 Willamette Dr
- 20930 Fawn Ct Unit 26
- 20111 Hoodview Ave
- 19770 Wildwood Dr
- 6558 Apollo Rd
- 6534 Apollo Rd
- 6566 Apollo Rd
- 6535 Palomino Way
- 6522 Apollo Rd
- 6547 Palomino Way
- 6529 Palomino Way
- 6543 Apollo Rd
- 6553 Palomino Way
- 6519 Apollo Rd
- 6553 Palomino Re-List
- 6553 Palomino :Re-Listed
- 6574 Apollo Rd
- 6512 Apollo Rd
- 6521 Palomino Way
- 6565 Apollo Rd
- 6578 Artemis Ln
- 6511 Apollo Rd
- 6559 Palomino Way
- 6564 Artemis Ln