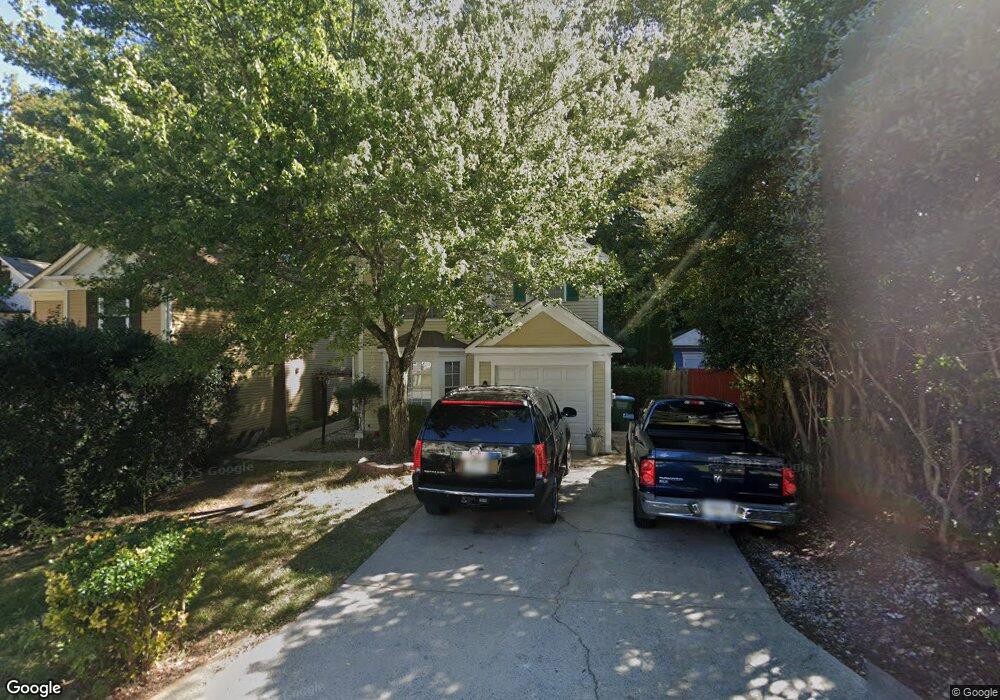
6548 E Windsor Ln Unit 3 Norcross, GA 30093
Estimated Value: $279,248 - $348,000
3
Beds
3
Baths
1,452
Sq Ft
$211/Sq Ft
Est. Value
About This Home
This home is located at 6548 E Windsor Ln Unit 3, Norcross, GA 30093 and is currently estimated at $306,562, approximately $211 per square foot. 6548 E Windsor Ln Unit 3 is a home located in Gwinnett County with nearby schools including Graves Elementary School, Louise Radloff Middle School, and Meadowcreek High School.
Ownership History
Date
Name
Owned For
Owner Type
Purchase Details
Closed on
Jan 5, 2004
Sold by
Bank Of America
Bought by
Todorov Jordan
Current Estimated Value
Home Financials for this Owner
Home Financials are based on the most recent Mortgage that was taken out on this home.
Original Mortgage
$100,700
Outstanding Balance
$46,198
Interest Rate
5.85%
Mortgage Type
New Conventional
Estimated Equity
$260,364
Purchase Details
Closed on
May 6, 2003
Sold by
Morgan Katherine
Bought by
Bank Of America
Purchase Details
Closed on
Sep 3, 1999
Sold by
Taylor Marc N and Taylor Tammy P
Bought by
Morgan Katherine
Home Financials for this Owner
Home Financials are based on the most recent Mortgage that was taken out on this home.
Original Mortgage
$101,000
Interest Rate
7.73%
Mortgage Type
New Conventional
Purchase Details
Closed on
Apr 30, 1996
Sold by
Caruso Richard Klamfoth
Bought by
Taylor Marc N Tammy P
Create a Home Valuation Report for This Property
The Home Valuation Report is an in-depth analysis detailing your home's value as well as a comparison with similar homes in the area
Home Values in the Area
Average Home Value in this Area
Purchase History
| Date | Buyer | Sale Price | Title Company |
|---|---|---|---|
| Todorov Jordan | $106,000 | -- | |
| Bank Of America | $112,888 | -- | |
| Morgan Katherine | $101,000 | -- | |
| Taylor Marc N Tammy P | $86,000 | -- |
Source: Public Records
Mortgage History
| Date | Status | Borrower | Loan Amount |
|---|---|---|---|
| Open | Todorov Jordan | $100,700 | |
| Previous Owner | Morgan Katherine | $101,000 | |
| Closed | Taylor Marc N Tammy P | $0 |
Source: Public Records
Tax History
| Year | Tax Paid | Tax Assessment Tax Assessment Total Assessment is a certain percentage of the fair market value that is determined by local assessors to be the total taxable value of land and additions on the property. | Land | Improvement |
|---|---|---|---|---|
| 2025 | $4,353 | $115,000 | $21,120 | $93,880 |
| 2024 | $4,179 | $108,760 | $21,120 | $87,640 |
| 2023 | $4,179 | $113,240 | $22,000 | $91,240 |
| 2022 | $0 | $86,800 | $14,000 | $72,800 |
| 2021 | $2,695 | $67,240 | $14,000 | $53,240 |
| 2020 | $2,709 | $67,240 | $14,000 | $53,240 |
| 2019 | $2,411 | $61,440 | $11,200 | $50,240 |
| 2018 | $2,051 | $51,520 | $11,200 | $40,320 |
| 2016 | $1,893 | $46,480 | $8,800 | $37,680 |
| 2015 | $1,392 | $31,720 | $6,800 | $24,920 |
| 2014 | $1,398 | $31,720 | $6,800 | $24,920 |
Source: Public Records
Map
Nearby Homes
- 6636 Witherington Ct
- 6711 Colchester Place
- 6715 Colchester Place
- 6716 Colchester Place
- 6718 Colchester Place Unit 205
- 6720 Colchester Place
- 6705 Witherington Ct NW
- 1563 Greenwood Dr
- 6727 Trafalger Square
- 6419 Danbury Ln
- 1807 Brookside Lay Cir
- 802 Olde Mill Ln
- 1763 Brookside Lay Cir
- 6734 Graves Mill Dr
- 1382 Branch Dr
- 306 Autumn Leaf Way
- 6751 Lismore Dr Unit 5
- 1387 Branch Dr
- 6875 Graves Mill Ct
- 1312 Branch Dr
- 6542 E Windsor Ln
- 6554 E Windsor Ln Unit 2
- 6536 E Windsor Ln
- 6560 E Windsor Ln
- 6530 E Windsor Ln Unit 3
- 6566 E Windsor Ln
- E E Windsor Ln Unit 32
- E E Windsor Ln Unit 10
- E E Windsor Ln Unit 2
- E E Windsor Ln Unit 8
- E E Windsor Ln Unit 4
- E E Windsor Ln
- 6549 E Windsor Ln
- 6555 E Windsor Ln
- 6524 E Windsor Ln
- 6543 E Windsor Ln Unit 3
- 6567 E Windsor Ln
- 6572 E Windsor Ln
- 6537 E Windsor Ln Unit 3
- 6518 E Windsor Ln Unit 6518
Your Personal Tour Guide
Ask me questions while you tour the home.