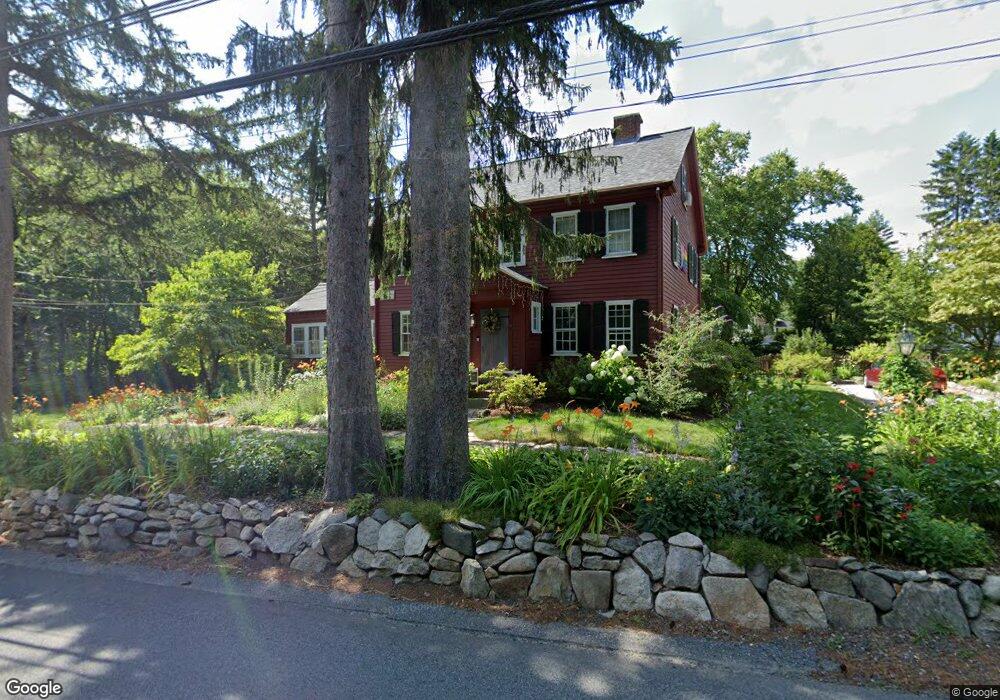
655 Belknap Rd Framingham, MA 01701
Estimated Value: $966,000 - $1,051,000
5
Beds
3
Baths
2,440
Sq Ft
$408/Sq Ft
Est. Value
About This Home
This home is located at 655 Belknap Rd, Framingham, MA 01701 and is currently estimated at $995,898, approximately $408 per square foot. 655 Belknap Rd is a home located in Middlesex County with nearby schools including Framingham High School, Summit Montessori School, and Sudbury Valley School.
Ownership History
Date
Name
Owned For
Owner Type
Purchase Details
Closed on
Nov 1, 2007
Sold by
Spellman Aimee D and Spellman Michael D
Bought by
Morningstar Kathryn H and Morningstar Marshall L
Current Estimated Value
Home Financials for this Owner
Home Financials are based on the most recent Mortgage that was taken out on this home.
Original Mortgage
$417,000
Interest Rate
6.43%
Mortgage Type
Purchase Money Mortgage
Purchase Details
Closed on
Nov 30, 2005
Sold by
Cocuzzo Gerard J and Cocuzzo Kathleen
Bought by
Spellman Aimee D and Spellman Michael D
Purchase Details
Closed on
Oct 6, 2003
Sold by
Cocuzzo Kathleen and Cocuzzo Gerard J
Bought by
Cocuzzo Gerard J and Cocuzzo Kathleen
Create a Home Valuation Report for This Property
The Home Valuation Report is an in-depth analysis detailing your home's value as well as a comparison with similar homes in the area
Home Values in the Area
Average Home Value in this Area
Purchase History
| Date | Buyer | Sale Price | Title Company |
|---|---|---|---|
| Morningstar Kathryn H | $539,900 | -- | |
| Morningstar Kathryn H | $539,900 | -- | |
| Spellman Aimee D | $500,000 | -- | |
| Spellman Aimee D | $500,000 | -- | |
| Cocuzzo Gerard J | -- | -- | |
| Cocuzzo Gerard J | -- | -- |
Source: Public Records
Mortgage History
| Date | Status | Borrower | Loan Amount |
|---|---|---|---|
| Open | Cocuzzo Gerard J | $410,000 | |
| Closed | Cocuzzo Gerard J | $416,000 | |
| Closed | Morningstar Kathryn H | $417,000 |
Source: Public Records
Tax History
| Year | Tax Paid | Tax Assessment Tax Assessment Total Assessment is a certain percentage of the fair market value that is determined by local assessors to be the total taxable value of land and additions on the property. | Land | Improvement |
|---|---|---|---|---|
| 2025 | $11,077 | $927,700 | $314,500 | $613,200 |
| 2024 | $10,653 | $855,000 | $280,200 | $574,800 |
| 2023 | $10,332 | $789,300 | $258,200 | $531,100 |
| 2022 | $9,941 | $723,500 | $234,600 | $488,900 |
| 2021 | $9,852 | $701,200 | $225,400 | $475,800 |
| 2020 | $10,568 | $705,500 | $204,900 | $500,600 |
| 2019 | $9,237 | $600,600 | $181,700 | $418,900 |
| 2018 | $10,272 | $629,400 | $178,100 | $451,300 |
| 2017 | $8,612 | $515,400 | $172,900 | $342,500 |
| 2016 | $8,876 | $510,700 | $174,500 | $336,200 |
| 2015 | $8,233 | $462,000 | $175,100 | $286,900 |
Source: Public Records
Map
Nearby Homes
- 21 Pleasantview Terrace
- 1 Vaillencourt Dr
- 15 Woodmere Rd
- 6 Tally Ho Ln
- 10 Bellwood Way
- 10 Tanglewood Dr Unit 10
- 401 Belknap Rd
- 11 Bellwood Way
- 37 Ledgewood Rd
- 5 Lavelle Ln
- 55 Ledgewood Rd
- 1550 Worcester Rd Unit 101
- 1321 Worcester Rd Unit 603
- 1321 Worcester Rd Unit 201
- 1321 Worcester Rd Unit 610
- 45 Gates St
- 576 Grove St
- 7 Thomas Dr
- 1500 Worcester Rd Unit 221
- 1500 Worcester Rd Unit 118
- 651 Belknap Rd
- 659 Belknap Rd
- 4 Flanagan Dr
- 624 Belknap Rd
- 622 Belknap Rd
- 649 Belknap Rd
- 6 Flanagan Dr
- 6 Flanagan Dr
- 3 Flanagan Dr
- 5 Flanagan Dr
- 21 Gibbs Valley Path
- 103 Flanagan Dr
- 8 Flanagan Dr
- 620 Belknap Rd
- 715 Pleasant St
- 667 Belknap Rd
- lot 3 Federal Ct
- 7 Flanagan Dr
- 7 Flanagan Dr
- 19 Gibbs Valley Path
Your Personal Tour Guide
Ask me questions while you tour the home.