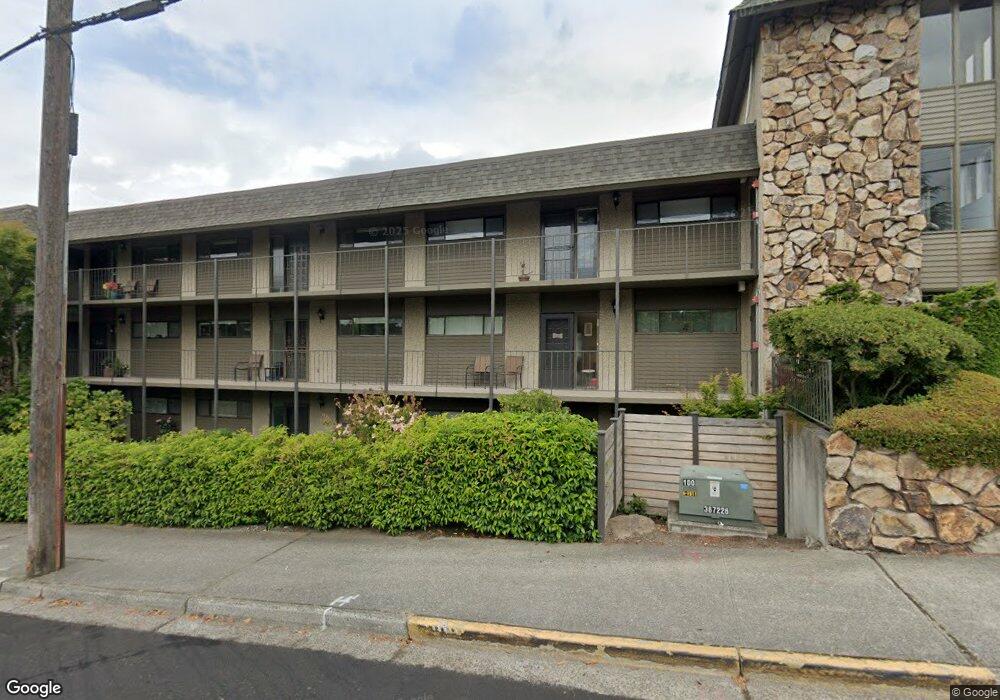
655 Main St Unit 205 Edmonds, WA 98020
Downtown Edmonds NeighborhoodEstimated Value: $781,988 - $853,000
2
Beds
2
Baths
1,218
Sq Ft
$680/Sq Ft
Est. Value
About This Home
This home is located at 655 Main St Unit 205, Edmonds, WA 98020 and is currently estimated at $827,747, approximately $679 per square foot. 655 Main St Unit 205 is a home located in Snohomish County with nearby schools including Edmonds Elementary School, College Place Middle School, and Edmonds-Woodway High School.
Ownership History
Date
Name
Owned For
Owner Type
Purchase Details
Closed on
Jun 9, 2010
Sold by
Hsbc Mortgage Services Inc
Bought by
Param Lila
Current Estimated Value
Home Financials for this Owner
Home Financials are based on the most recent Mortgage that was taken out on this home.
Original Mortgage
$239,920
Outstanding Balance
$155,361
Interest Rate
4.76%
Mortgage Type
New Conventional
Estimated Equity
$672,386
Purchase Details
Closed on
Dec 18, 2009
Sold by
Smith Donald Wayne
Bought by
Hsbc Mortgage Services Inc
Purchase Details
Closed on
Dec 22, 2005
Sold by
Reddick Arthur D
Bought by
Smith Donald Wayne
Home Financials for this Owner
Home Financials are based on the most recent Mortgage that was taken out on this home.
Original Mortgage
$330,000
Interest Rate
7.59%
Mortgage Type
Fannie Mae Freddie Mac
Purchase Details
Closed on
Jun 20, 2002
Sold by
Reddick Arthur D
Bought by
Reddick Arthur D
Create a Home Valuation Report for This Property
The Home Valuation Report is an in-depth analysis detailing your home's value as well as a comparison with similar homes in the area
Home Values in the Area
Average Home Value in this Area
Purchase History
| Date | Buyer | Sale Price | Title Company |
|---|---|---|---|
| Param Lila | $299,900 | Accommodation | |
| Hsbc Mortgage Services Inc | $313,984 | Accommodation | |
| Smith Donald Wayne | $330,000 | Pnwt | |
| Reddick Arthur D | -- | -- |
Source: Public Records
Mortgage History
| Date | Status | Borrower | Loan Amount |
|---|---|---|---|
| Open | Param Lila | $239,920 | |
| Previous Owner | Smith Donald Wayne | $330,000 |
Source: Public Records
Tax History
| Year | Tax Paid | Tax Assessment Tax Assessment Total Assessment is a certain percentage of the fair market value that is determined by local assessors to be the total taxable value of land and additions on the property. | Land | Improvement |
|---|---|---|---|---|
| 2026 | $5,043 | $738,800 | $209,000 | $529,800 |
| 2025 | $5,234 | $710,400 | $209,000 | $501,400 |
| 2024 | $5,234 | $735,600 | $209,000 | $526,600 |
| 2023 | $5,292 | $770,700 | $209,000 | $561,700 |
| 2022 | $5,597 | $670,200 | $190,000 | $480,200 |
| 2020 | $5,332 | $571,000 | $190,000 | $381,000 |
| 2019 | $5,144 | $554,800 | $190,000 | $364,800 |
| 2018 | $5,106 | $475,800 | $190,000 | $285,800 |
| 2017 | $3,733 | $364,000 | $88,500 | $275,500 |
| 2016 | $3,395 | $328,000 | $70,500 | $257,500 |
| 2015 | $3,276 | $298,000 | $65,500 | $232,500 |
| 2013 | $3,159 | $271,000 | $87,500 | $183,500 |
Source: Public Records
Map
Nearby Homes
- 640 Bell St
- 645 Bell St Unit 102
- 624 Alder St
- 712 Alder St
- 621 Daley St
- 626 Glen St Unit 201
- 546 Walnut St Unit 201
- 609 7th Ave N Unit B304
- 217 9th Ave S
- 556 Holly Dr
- 816 Walnut St
- 926 Dayton St
- 233 3rd Ave S Unit 305
- 623 Aloha Way
- 647 9th Ave N
- 200 James St Unit 307
- 614 5th Ave S Unit C101
- 614 5th Ave S Unit C107
- 902 7th Ave S
- 1021 Walnut St
- 655 Main St Unit 405
- 655 Main St Unit 404
- 655 Main St Unit 305
- 655 Main St Unit 303
- 655 Main St Unit 302
- 655 Main St Unit 301
- 655 Main St Unit 204
- 655 Main St Unit 203
- 655 Main St Unit 202
- 655 Main St Unit 201
- 655 Main St Unit 103
- 655 Main St Unit 102
- 655 Main St Unit 101
- 655 Main St
- 107 7th Ave N Unit 100
- 107 7th Ave N Unit 200
- 107 7th Ave N Unit 101
- 650 Bell St
- 660 Bell St
- 644 Bell St
Your Personal Tour Guide
Ask me questions while you tour the home.