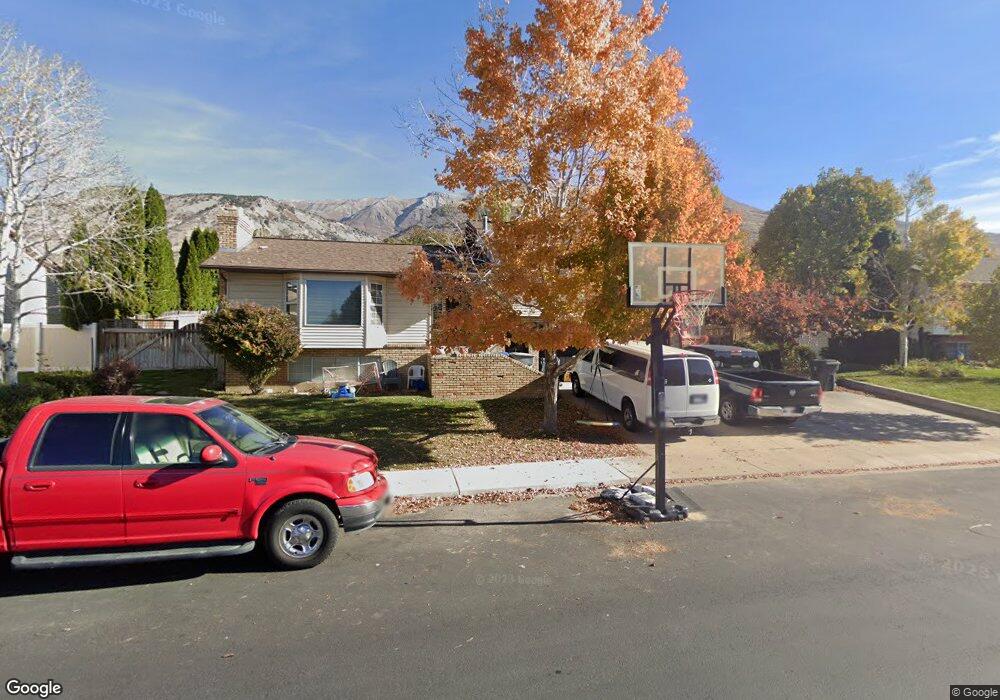
655 S Mohawk Ave Pleasant Grove, UT 84062
Estimated Value: $640,000 - $649,000
5
Beds
3
Baths
2,757
Sq Ft
$234/Sq Ft
Est. Value
About This Home
This home is located at 655 S Mohawk Ave, Pleasant Grove, UT 84062 and is currently estimated at $644,226, approximately $233 per square foot. 655 S Mohawk Ave is a home located in Utah County with nearby schools including Central Elementary School, Oak Canyon Junior High School, and Pleasant Grove High School.
Ownership History
Date
Name
Owned For
Owner Type
Purchase Details
Closed on
Dec 29, 2006
Sold by
Huffmon Mary Lou
Bought by
Taylor Adam
Current Estimated Value
Purchase Details
Closed on
Sep 24, 1999
Sold by
Huffman Mary Lou
Bought by
Huffman Mary Lou
Purchase Details
Closed on
Apr 26, 1999
Sold by
Francom Steven L and Francom Sandra L
Bought by
Huffman Mary Lou
Home Financials for this Owner
Home Financials are based on the most recent Mortgage that was taken out on this home.
Original Mortgage
$149,300
Interest Rate
6.98%
Purchase Details
Closed on
Oct 15, 1998
Sold by
Val Dev L C
Bought by
Pleasant Grove City
Create a Home Valuation Report for This Property
The Home Valuation Report is an in-depth analysis detailing your home's value as well as a comparison with similar homes in the area
Home Values in the Area
Average Home Value in this Area
Purchase History
| Date | Buyer | Sale Price | Title Company |
|---|---|---|---|
| Taylor Adam | -- | Beehive Title Insurance Age | |
| Huffman Mary Lou | -- | Equity Title Agency Inc | |
| Huffman Mary Lou | -- | Action Title Company | |
| Pleasant Grove City | -- | -- |
Source: Public Records
Mortgage History
| Date | Status | Borrower | Loan Amount |
|---|---|---|---|
| Previous Owner | Huffman Mary Lou | $149,300 |
Source: Public Records
Tax History
| Year | Tax Paid | Tax Assessment Tax Assessment Total Assessment is a certain percentage of the fair market value that is determined by local assessors to be the total taxable value of land and additions on the property. | Land | Improvement |
|---|---|---|---|---|
| 2025 | $2,441 | $306,680 | -- | -- |
| 2024 | $2,441 | $291,500 | $0 | $0 |
| 2023 | $2,435 | $297,550 | $0 | $0 |
| 2022 | $2,454 | $298,320 | $0 | $0 |
| 2021 | $2,175 | $402,600 | $134,600 | $268,000 |
| 2020 | $1,993 | $361,600 | $120,200 | $241,400 |
| 2019 | $1,851 | $347,400 | $106,000 | $241,400 |
| 2018 | $1,837 | $325,900 | $99,000 | $226,900 |
| 2017 | $1,663 | $157,135 | $0 | $0 |
| 2016 | $1,604 | $146,300 | $0 | $0 |
| 2015 | $1,615 | $139,480 | $0 | $0 |
| 2014 | $1,612 | $137,940 | $0 | $0 |
Source: Public Records
Map
Nearby Homes
Your Personal Tour Guide
Ask me questions while you tour the home.