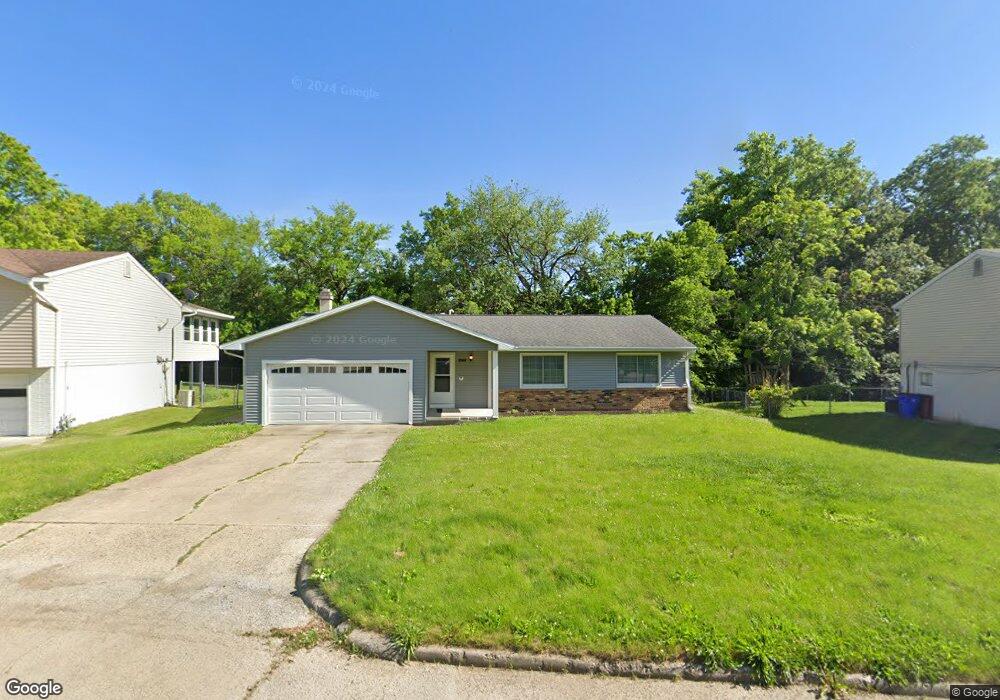
655 S Whitetail Cir Mount Zion, IL 62549
Estimated Value: $168,000 - $190,000
3
Beds
2
Baths
1,352
Sq Ft
$133/Sq Ft
Est. Value
About This Home
This home is located at 655 S Whitetail Cir, Mount Zion, IL 62549 and is currently estimated at $180,329, approximately $133 per square foot. 655 S Whitetail Cir is a home located in Macon County with nearby schools including McGaughey Elementary School, Mt. Zion Intermediate School, and Mt. Zion Elementary School.
Ownership History
Date
Name
Owned For
Owner Type
Purchase Details
Closed on
May 28, 2021
Sold by
Hesse Jason M and Hesse Melissa A
Bought by
Hesse Justin
Current Estimated Value
Home Financials for this Owner
Home Financials are based on the most recent Mortgage that was taken out on this home.
Original Mortgage
$120,000
Outstanding Balance
$108,814
Interest Rate
3%
Mortgage Type
New Conventional
Estimated Equity
$71,515
Purchase Details
Closed on
Jan 17, 2006
Sold by
Pyatt Tina Sue and Pyatt Tina Sue
Bought by
Hesse Jason M and Hesse Milissa A
Home Financials for this Owner
Home Financials are based on the most recent Mortgage that was taken out on this home.
Original Mortgage
$92,000
Interest Rate
6.46%
Mortgage Type
New Conventional
Purchase Details
Closed on
Jul 1, 1994
Create a Home Valuation Report for This Property
The Home Valuation Report is an in-depth analysis detailing your home's value as well as a comparison with similar homes in the area
Home Values in the Area
Average Home Value in this Area
Purchase History
| Date | Buyer | Sale Price | Title Company |
|---|---|---|---|
| Hesse Justin | $125,000 | None Available | |
| Hesse Jason M | $92,000 | None Available | |
| -- | $64,000 | -- |
Source: Public Records
Mortgage History
| Date | Status | Borrower | Loan Amount |
|---|---|---|---|
| Open | Hesse Justin | $120,000 | |
| Previous Owner | Hesse Jason M | $92,000 |
Source: Public Records
Tax History Compared to Growth
Tax History
| Year | Tax Paid | Tax Assessment Tax Assessment Total Assessment is a certain percentage of the fair market value that is determined by local assessors to be the total taxable value of land and additions on the property. | Land | Improvement |
|---|---|---|---|---|
| 2024 | $3,370 | $49,171 | $7,261 | $41,910 |
| 2023 | $3,245 | $45,732 | $6,753 | $38,979 |
| 2022 | $3,093 | $43,376 | $6,405 | $36,971 |
| 2021 | $2,988 | $40,636 | $6,000 | $34,636 |
| 2020 | $2,813 | $38,995 | $4,977 | $34,018 |
| 2019 | $2,813 | $38,995 | $4,977 | $34,018 |
| 2018 | $2,722 | $37,999 | $4,850 | $33,149 |
| 2017 | $2,681 | $37,269 | $4,757 | $32,512 |
| 2016 | $2,650 | $36,621 | $4,674 | $31,947 |
| 2015 | $2,560 | $36,259 | $4,628 | $31,631 |
| 2014 | $2,468 | $36,259 | $4,628 | $31,631 |
| 2013 | $2,497 | $36,259 | $4,628 | $31,631 |
Source: Public Records
Map
Nearby Homes
- 570 Fawn Ct
- 574 N Antler Dr
- 925 S Wildwood Dr
- 860 W Wildwood Dr
- 1440 N Alexander Dr
- 3930 S Mount Zion Rd
- 125 W Walnut St
- 1610 Robin Ct
- 820 Kirk Dr
- 24 Buttonridge Place
- 400 Maddox Dr
- 50 Sundance Dr
- 524 Elm St
- 402 Rolling Green Dr
- 265 Carrington Ave
- 1820 Buckhead Ln
- 3330 S Baltimore Ave
- 2125 Buckhead Ave
- 2130 Buckhead Ave
- 355 S Henderson St
- 665 S Whitetail Cir
- 645 S Whitetail Cir
- 675 S Whitetail Cir
- 635 S Whitetail Cir
- 650 S Whitetail Cir
- 620 S Whitetail Cir
- 660 S Whitetail Cir
- 685 S Whitetail Cir
- 625 S Whitetail Cir
- 670 S Whitetail Cir
- 1301 Woodland Dr
- 615 N Whitetail Cir
- 610 S Whitetail Cir
- 615 S Whitetail Cir
- 695 S Whitetail Cir
- 625 N Whitetail Cir
- 680 S Whitetail Cir
- 635 N Whitetail Cir
- 605 S Whitetail Cir
- 705 S Whitetail Cir