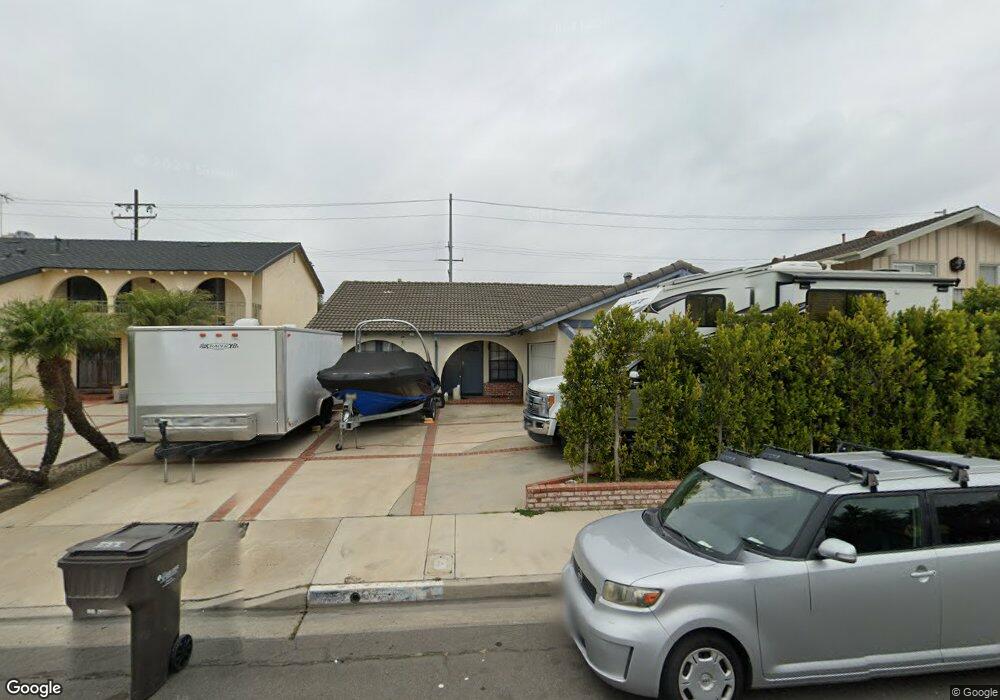
6551 Crista Palma Dr Huntington Beach, CA 92647
Estimated Value: $1,360,516 - $1,757,000
4
Beds
3
Baths
2,031
Sq Ft
$742/Sq Ft
Est. Value
About This Home
This home is located at 6551 Crista Palma Dr, Huntington Beach, CA 92647 and is currently estimated at $1,507,379, approximately $742 per square foot. 6551 Crista Palma Dr is a home located in Orange County with nearby schools including Golden View Elementary School - Environmental Science School, Mesa View Middle School, and Ocean View High.
Ownership History
Date
Name
Owned For
Owner Type
Purchase Details
Closed on
Jun 17, 2019
Sold by
Richey Brian Russell and Raymond T Richey Irrevocable T
Bought by
Richey Brian Russell
Current Estimated Value
Purchase Details
Closed on
Aug 27, 2015
Sold by
Richey Raymond T
Bought by
Richey Brian Russell and Raymond T Richey Irrevocable Trust
Purchase Details
Closed on
Oct 29, 2014
Sold by
Richey Raymond T and Richey Margie Anne
Bought by
Richey Raymond T
Purchase Details
Closed on
Jul 29, 1997
Sold by
Richey Raymond T and Richey Margie Anne
Bought by
Richey Raymond T and Richey Margie Anne
Purchase Details
Closed on
Sep 4, 1996
Sold by
Cross Jean M
Bought by
Richey Raymond T and Richey Margie Anne
Purchase Details
Closed on
Jul 27, 1995
Sold by
Cross James K and Cross Adrienne Gibson
Bought by
Cross Jean M
Create a Home Valuation Report for This Property
The Home Valuation Report is an in-depth analysis detailing your home's value as well as a comparison with similar homes in the area
Home Values in the Area
Average Home Value in this Area
Purchase History
| Date | Buyer | Sale Price | Title Company |
|---|---|---|---|
| Richey Brian Russell | -- | None Available | |
| Richey Brian Russell | -- | None Available | |
| Richey Raymond T | -- | None Available | |
| Richey Raymond T | -- | -- | |
| Richey Raymond T | $235,000 | -- | |
| Cross Jean M | -- | Orange Coast Title |
Source: Public Records
Tax History Compared to Growth
Tax History
| Year | Tax Paid | Tax Assessment Tax Assessment Total Assessment is a certain percentage of the fair market value that is determined by local assessors to be the total taxable value of land and additions on the property. | Land | Improvement |
|---|---|---|---|---|
| 2025 | $4,501 | $382,730 | $248,530 | $134,200 |
| 2024 | $4,501 | $375,226 | $243,657 | $131,569 |
| 2023 | $4,398 | $367,869 | $238,879 | $128,990 |
| 2022 | $4,331 | $360,656 | $234,195 | $126,461 |
| 2021 | $4,253 | $353,585 | $229,603 | $123,982 |
| 2020 | $4,206 | $349,960 | $227,249 | $122,711 |
| 2019 | $4,135 | $343,099 | $222,794 | $120,305 |
| 2018 | $4,044 | $336,372 | $218,425 | $117,947 |
| 2017 | $3,981 | $329,777 | $214,142 | $115,635 |
| 2016 | $3,822 | $323,311 | $209,943 | $113,368 |
| 2015 | $3,763 | $318,455 | $206,789 | $111,666 |
| 2014 | $3,690 | $312,217 | $202,738 | $109,479 |
Source: Public Records
Map
Nearby Homes
- 6611 Crista Palma Dr
- 17231 Lido Ln
- 6600 Warner Ave Unit 50
- 6600 Warner Ave
- 6600 Warner Ave Unit 142
- 6672 Sun Dr Unit B
- 16892 Limelight Cir Unit B
- 6301 Warner Ave Unit 40
- 6301 Warner Ave Unit 88
- 17071 Pinehurst Ln
- 6051 Summerdale Dr
- 5862 Raphael Dr
- 17261 Gothard St Unit 50
- 17261 Gothard St Unit 67
- 17261 Gothard St Unit 63
- 17261 Gothard St Unit 64
- 6012 Jasonwood Dr
- 5812 Raphael Dr
- 17372 Forbes Ln
- 6161 Norbrook Dr
- 6541 Crista Palma Dr
- 6561 Crista Palma Dr
- 6531 Crista Palma Dr
- 6571 Crista Palma Dr
- 6552 Crista Palma Dr
- 6542 Crista Palma Dr
- 6562 Crista Palma Dr
- 6521 Crista Palma Dr
- 6582 Cory Dr
- 6581 Crista Palma Dr
- 6592 Cory Dr
- 6532 Crista Palma Dr
- 6572 Cory Dr
- 6572 Crista Palma Dr
- 6602 Cory Dr
- 6552 Cory Dr
- 6522 Crista Palma Dr
- 6591 Crista Palma Dr
- 6511 Crista Palma Dr
- 6612 Cory Dr