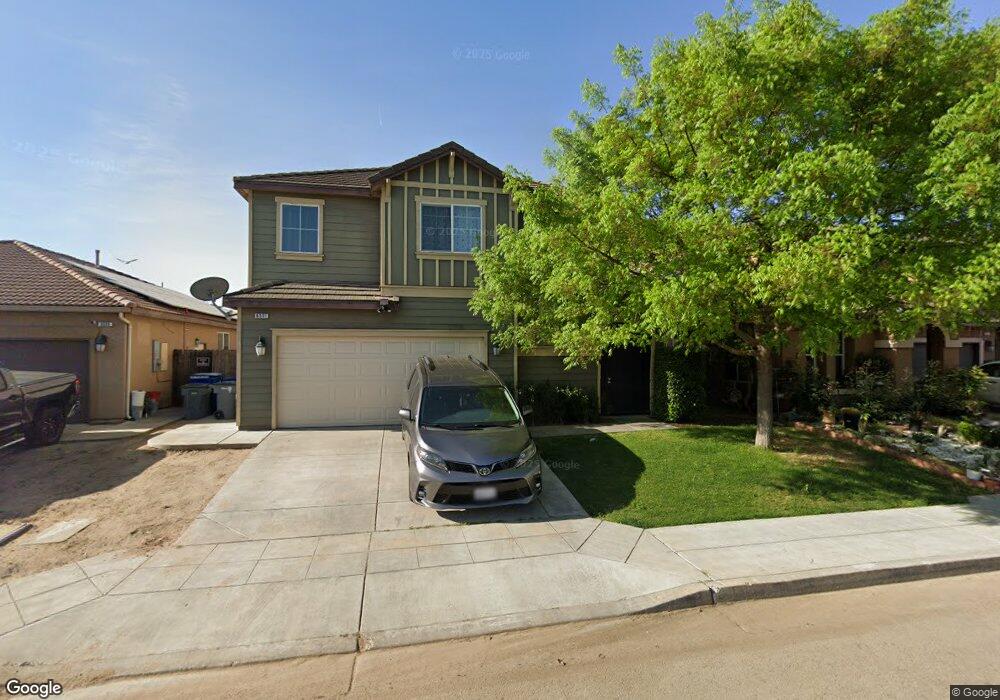
6551 E Cetti Ave Unit Lot90 Fresno, CA 93727
Sunnyside NeighborhoodEstimated Value: $439,381 - $461,000
4
Beds
3
Baths
1,979
Sq Ft
$229/Sq Ft
Est. Value
About This Home
This home is located at 6551 E Cetti Ave Unit Lot90, Fresno, CA 93727 and is currently estimated at $452,345, approximately $228 per square foot. 6551 E Cetti Ave Unit Lot90 is a home located in Fresno County with nearby schools including John S. Wash Elementary School, Washington Academic Middle School, and Sanger High School.
Ownership History
Date
Name
Owned For
Owner Type
Purchase Details
Closed on
May 16, 2013
Sold by
Secretary Of Housing & Urban Development
Bought by
Tran Cang
Current Estimated Value
Home Financials for this Owner
Home Financials are based on the most recent Mortgage that was taken out on this home.
Original Mortgage
$141,240
Outstanding Balance
$99,633
Interest Rate
3.38%
Mortgage Type
New Conventional
Estimated Equity
$352,712
Purchase Details
Closed on
Dec 3, 2012
Sold by
Bank Of America Na
Bought by
The Secretary Of Housing & Urban Develop
Purchase Details
Closed on
Sep 4, 2008
Sold by
D R Horton Inc Fresno
Bought by
Vang May Nhia
Home Financials for this Owner
Home Financials are based on the most recent Mortgage that was taken out on this home.
Original Mortgage
$241,153
Interest Rate
6.5%
Mortgage Type
FHA
Create a Home Valuation Report for This Property
The Home Valuation Report is an in-depth analysis detailing your home's value as well as a comparison with similar homes in the area
Home Values in the Area
Average Home Value in this Area
Purchase History
| Date | Buyer | Sale Price | Title Company |
|---|---|---|---|
| Tran Cang | $177,000 | Chicago Title Company | |
| The Secretary Of Housing & Urban Develop | -- | Landsafe Title | |
| Bank Of America N A | $305,702 | Landsafe Title | |
| Vang May Nhia | $245,000 | First American Title Company |
Source: Public Records
Mortgage History
| Date | Status | Borrower | Loan Amount |
|---|---|---|---|
| Open | Tran Cang | $141,240 | |
| Previous Owner | Vang May Nhia | $241,153 |
Source: Public Records
Tax History Compared to Growth
Tax History
| Year | Tax Paid | Tax Assessment Tax Assessment Total Assessment is a certain percentage of the fair market value that is determined by local assessors to be the total taxable value of land and additions on the property. | Land | Improvement |
|---|---|---|---|---|
| 2025 | $2,810 | $217,331 | $43,093 | $174,238 |
| 2023 | $2,755 | $208,894 | $41,421 | $167,473 |
| 2022 | $2,691 | $204,799 | $40,609 | $164,190 |
| 2021 | $2,660 | $200,784 | $39,813 | $160,971 |
| 2020 | $2,580 | $198,726 | $39,405 | $159,321 |
| 2019 | $2,511 | $194,831 | $38,633 | $156,198 |
| 2018 | $2,424 | $191,012 | $37,876 | $153,136 |
| 2017 | $2,350 | $187,268 | $37,134 | $150,134 |
| 2016 | $2,250 | $183,597 | $36,406 | $147,191 |
| 2015 | $2,333 | $180,841 | $35,860 | $144,981 |
| 2014 | $2,324 | $177,300 | $35,158 | $142,142 |
Source: Public Records
Map
Nearby Homes
- 810 S Cypress Ave
- 6825 E Braly Ave
- 6288 E Woodward Ave
- 6856 E Geary St
- 6259 E Liberty Ave
- 6671 E Lane Ave
- 1904 S Fairway Ave
- 6798 E Raco Ave
- 284 S Temperance Ave
- 6753 E Alta Ave
- 5976 E Butler Ave
- 6601 E Liberty Ave
- 5912 E Hamilton Ave
- 6154 E Alta Ave
- 6164 E Church Ave
- 2163 S Bundy Dr
- 5894 E Hamilton Ave
- 1412 S Temperance Ave
- 6407 E Inyo St
- 5875 E Pitt Ave
- 6551 E Cetti Ave
- 6559 E Cetti Ave
- 6543 E Cetti Ave Unit Lot91
- 6543 E Cetti Ave
- 6535 E Cetti Ave
- 6567 E Cetti Ave
- 6552 E Braly Ave Unit Lot59
- 6552 E Braly Ave
- 6544 E Braly Ave Unit Lot58
- 6544 E Braly Ave
- 6560 E Braly Ave
- 6536 E Braly Ave Unit Lot57
- 6536 E Braly Ave
- 6575 E Cetti Ave
- 822 S Filbert Ave Unit Lot48
- 822 S Filbert Ave
- 6568 E Braly Ave Unit Lot61
- 6568 E Braly Ave
- 6562 E Cetti Ave
- 816 S Filbert Ave Unit Lot49