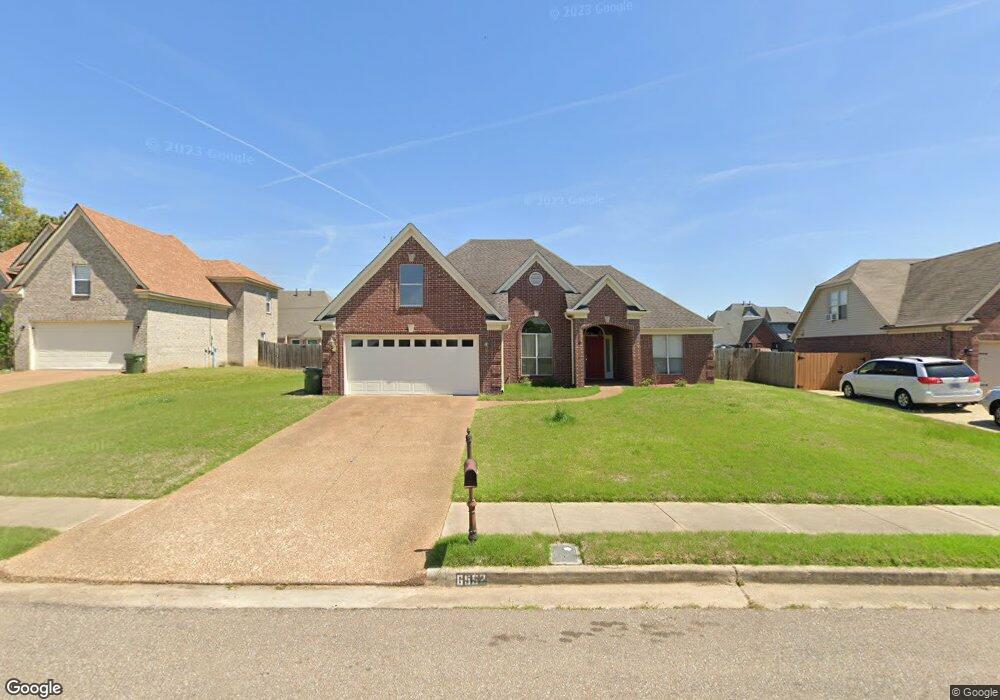
6552 Misslow Cove Millington, TN 38053
Estimated Value: $295,000 - $318,000
4
Beds
2
Baths
2,899
Sq Ft
$105/Sq Ft
Est. Value
About This Home
This home is located at 6552 Misslow Cove, Millington, TN 38053 and is currently estimated at $303,301, approximately $104 per square foot. 6552 Misslow Cove is a home located in Shelby County with nearby schools including Millington Elementary School, Millington High School, and Woodlawn Baptist Academy.
Ownership History
Date
Name
Owned For
Owner Type
Purchase Details
Closed on
Apr 22, 2010
Sold by
Williamson Raychellet and Williamson Len
Bought by
Shepard Carmen
Current Estimated Value
Home Financials for this Owner
Home Financials are based on the most recent Mortgage that was taken out on this home.
Original Mortgage
$142,373
Outstanding Balance
$97,144
Interest Rate
5.5%
Mortgage Type
FHA
Estimated Equity
$206,157
Purchase Details
Closed on
Sep 16, 2004
Sold by
Atrium Homes Llc
Bought by
Williamson Len and Williamson Raychellet
Home Financials for this Owner
Home Financials are based on the most recent Mortgage that was taken out on this home.
Original Mortgage
$153,000
Interest Rate
7.6%
Mortgage Type
Purchase Money Mortgage
Purchase Details
Closed on
Oct 1, 2003
Sold by
Trustmark Bank
Bought by
Atrium Homes Llc
Home Financials for this Owner
Home Financials are based on the most recent Mortgage that was taken out on this home.
Original Mortgage
$125,000
Interest Rate
6.28%
Mortgage Type
Construction
Create a Home Valuation Report for This Property
The Home Valuation Report is an in-depth analysis detailing your home's value as well as a comparison with similar homes in the area
Home Values in the Area
Average Home Value in this Area
Purchase History
| Date | Buyer | Sale Price | Title Company |
|---|---|---|---|
| Shepard Carmen | $145,000 | Realty Title & Escrow Co Inc | |
| Williamson Len | $180,000 | -- | |
| Atrium Homes Llc | $23,000 | Stewart Title Of Memphis Inc |
Source: Public Records
Mortgage History
| Date | Status | Borrower | Loan Amount |
|---|---|---|---|
| Open | Shepard Carmen | $142,373 | |
| Previous Owner | Williamson Len | $153,000 | |
| Previous Owner | Atrium Homes Llc | $125,000 |
Source: Public Records
Tax History Compared to Growth
Tax History
| Year | Tax Paid | Tax Assessment Tax Assessment Total Assessment is a certain percentage of the fair market value that is determined by local assessors to be the total taxable value of land and additions on the property. | Land | Improvement |
|---|---|---|---|---|
| 2025 | $1,583 | $75,475 | $8,500 | $66,975 |
| 2024 | $3,834 | $56,550 | $7,650 | $48,900 |
| 2023 | $2,709 | $56,550 | $7,650 | $48,900 |
| 2022 | $2,709 | $56,550 | $7,650 | $48,900 |
| 2021 | $2,743 | $56,550 | $7,650 | $48,900 |
| 2020 | $2,265 | $40,600 | $7,650 | $32,950 |
| 2019 | $1,644 | $40,600 | $7,650 | $32,950 |
| 2018 | $2,265 | $40,600 | $7,650 | $32,950 |
| 2017 | $2,290 | $40,600 | $7,650 | $32,950 |
| 2016 | $2,252 | $38,175 | $0 | $0 |
| 2014 | $1,668 | $38,175 | $0 | $0 |
Source: Public Records
Map
Nearby Homes
- 4469 Queen Sinclair Cir
- 4537 Kings Station Rd
- 4235 Sykes Rd
- 6866 Basun Cir E
- 4600 Goldsby Place
- 4578 Basun Cir E
- 4140 Pleasant Ridge Rd
- 4531 Basun Cir S
- 4527 Basun Cir S
- 4537 Basun Cir S
- 4578 Basun Cir N
- 4703 Cedar Rose Dr
- 7266 Raleigh Millington Rd
- 4288 Peach Run Lane Ln
- 4551 Waverly Farms Rd
- 5975 Prairie Cove
- 4302 Peach Run Lane Ln
- 4315 Peach Run Lane Ln
- 4306 Peach Run Ln
- 4321 Peach Run Ln
- 6548 Misslow Cove
- 6558 Misslow Cove
- 6555 Annielee St
- 6551 Annielee St
- 6559 Annielee St
- 6544 Misslow Cove
- 6557 Misslow Cove
- 6551 Misslow Cove
- 6568 Misslow Cove
- 6543 Annielee St
- 4400 Jeffery St
- 6563 Misslow Cove
- 6540 Misslow Cove
- 6571 Misslow Cove
- 6539 Annielee St
- 4432 Ellen St
- 4429 Ellen St
- 6558 Jack Cove
- 6552 Jack Cove
- 6536 Angie St