Estimated Value: $200,613 - $275,000
3
Beds
2
Baths
1,365
Sq Ft
$171/Sq Ft
Est. Value
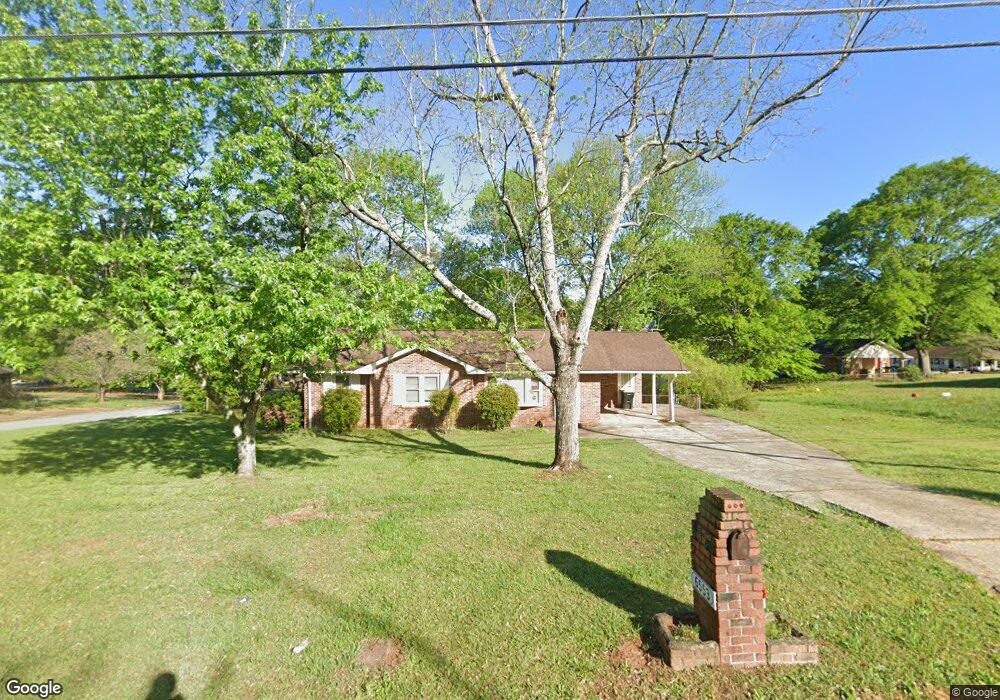
About This Home
This home is located at 6553 Fielder Rd, Rex, GA 30273 and is currently estimated at $232,903, approximately $170 per square foot. 6553 Fielder Rd is a home located in Clayton County with nearby schools including William M. Mcgarrah Elementary School, Rex Mill Middle School, and Mount Zion High School.
Ownership History
Date
Name
Owned For
Owner Type
Purchase Details
Closed on
Sep 26, 2019
Sold by
Le Hung K
Bought by
Johns Jessica Denise
Current Estimated Value
Home Financials for this Owner
Home Financials are based on the most recent Mortgage that was taken out on this home.
Original Mortgage
$123,391
Outstanding Balance
$109,354
Interest Rate
4.4%
Mortgage Type
FHA
Estimated Equity
$123,549
Purchase Details
Closed on
Oct 28, 2014
Sold by
Le Hung K
Bought by
Le Hung K and Bui Bong T
Purchase Details
Closed on
Feb 28, 2014
Sold by
Le Hung K
Bought by
Le Hung K and Bui Bong T
Purchase Details
Closed on
May 18, 2010
Sold by
Hud-Housing Of Urban Dev
Bought by
Le Hung K
Purchase Details
Closed on
Aug 4, 2009
Sold by
Midfirst Bk
Bought by
Hud-Housing Of Urban Dev
Purchase Details
Closed on
Apr 27, 2001
Sold by
Smith Lawana A and Smith Charles T
Bought by
Chisholm Kiasha E
Home Financials for this Owner
Home Financials are based on the most recent Mortgage that was taken out on this home.
Original Mortgage
$92,350
Interest Rate
6.98%
Mortgage Type
FHA
Purchase Details
Closed on
Dec 15, 1995
Sold by
Darby Willadean G
Bought by
Smith Charles Lawana A
Create a Home Valuation Report for This Property
The Home Valuation Report is an in-depth analysis detailing your home's value as well as a comparison with similar homes in the area
Home Values in the Area
Average Home Value in this Area
Purchase History
| Date | Buyer | Sale Price | Title Company |
|---|---|---|---|
| Johns Jessica Denise | $129,000 | -- | |
| Le Hung K | -- | -- | |
| Le Hung K | -- | -- | |
| Le Hung K | -- | -- | |
| Hud-Housing Of Urban Dev | -- | -- | |
| Midfirst Bank | $131,976 | -- | |
| Chisholm Kiasha E | $93,800 | -- | |
| Smith Charles Lawana A | $66,900 | -- |
Source: Public Records
Mortgage History
| Date | Status | Borrower | Loan Amount |
|---|---|---|---|
| Open | Johns Jessica Denise | $123,391 | |
| Previous Owner | Chisholm Kiasha E | $92,350 | |
| Closed | Smith Charles Lawana A | $0 |
Source: Public Records
Tax History
| Year | Tax Paid | Tax Assessment Tax Assessment Total Assessment is a certain percentage of the fair market value that is determined by local assessors to be the total taxable value of land and additions on the property. | Land | Improvement |
|---|---|---|---|---|
| 2025 | $3,110 | $91,200 | $7,200 | $84,000 |
| 2024 | $3,168 | $91,200 | $7,200 | $84,000 |
| 2023 | $620 | $91,200 | $7,200 | $84,000 |
| 2022 | $2,513 | $74,040 | $7,200 | $66,840 |
| 2021 | $1,945 | $59,240 | $7,200 | $52,040 |
| 2020 | $1,664 | $51,600 | $7,200 | $44,400 |
| 2019 | $1,396 | $34,394 | $6,400 | $27,994 |
| 2018 | $1,039 | $25,600 | $6,400 | $19,200 |
| 2017 | $1,042 | $25,600 | $6,400 | $19,200 |
| 2016 | $899 | $25,980 | $6,400 | $19,580 |
| 2015 | $961 | $0 | $0 | $0 |
| 2014 | $977 | $24,562 | $6,400 | $18,162 |
Source: Public Records
Map
Nearby Homes
- 6637 Bedford Rd Unit 2
- 6498 Carolyn Ct
- 3003 Menlo Park Dr
- 6697 Cambridge Dr
- 6692 Cambridge Dr
- 6708 Bedford Rd
- 6677 Fielder Rd
- 6706 Bent Creek Dr
- 6485 Bobolink Ct
- 3315 Canterbury Trail
- 6359 Towhee Way
- 6357 Towhee Way
- 6348 Towhee Way
- 6355 Towhee Way
- 6371 Towhee Way
- 6354 Towhee Way
- 6343 Towhee Way
- 6389 Warbler Ct
- 6379 Warbler Ct
- 6387 Warbler Ct
- 3112 Bobolink Dr Unit 1
- 3115 Bobolink Dr Unit 1
- 6539 Fielder Rd
- 3104 Bobolink Dr
- 3119 Cabriolet Trail
- 3101 Bobolink Dr
- 6546 Fielder Rd
- 3113 Cabriolet Trail
- 3096 Bobolink Dr
- 6565 Fielder Rd
- 3085 Bobolink Dr Unit 1
- 6538 Fielder Rd
- 3107 Cabriolet Trail
- 3088 Bobolink Dr
- 6558 Fielder Rd
- 3126 Cabriolet Trail
- 3155 Andrea Ln
- 3120 Cabriolet Trail
- 6571 Fielder Rd
- 3101 Cabriolet Trail
Your Personal Tour Guide
Ask me questions while you tour the home.