6555 E Hannibal St Mesa, AZ 85205
Central Mesa East NeighborhoodEstimated Value: $458,000 - $603,000
3
Beds
2
Baths
1,680
Sq Ft
$309/Sq Ft
Est. Value
About This Home
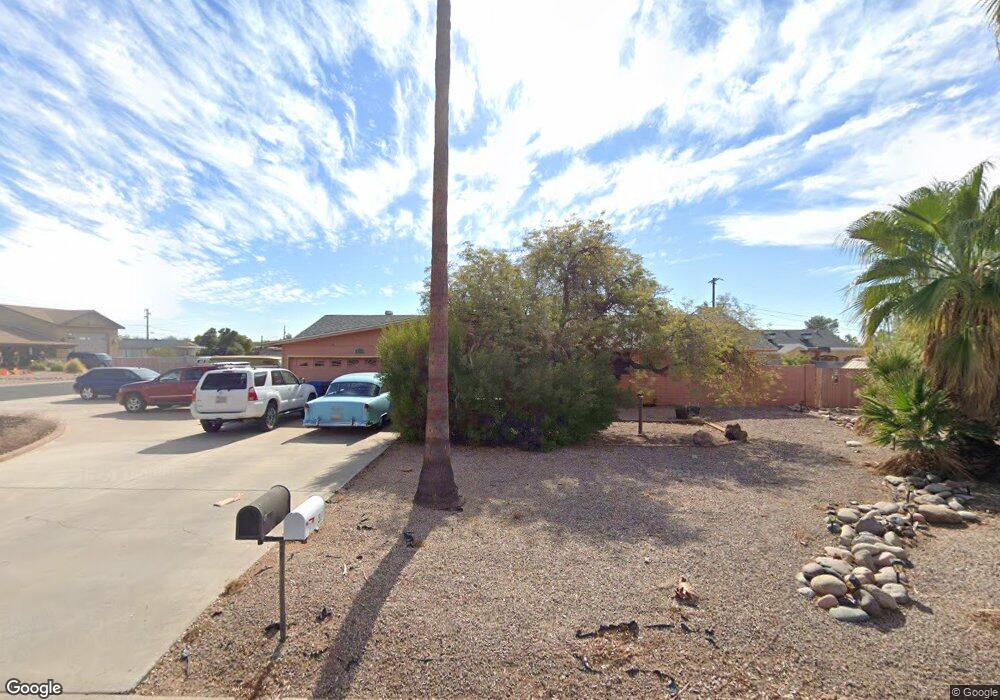
This home is located at 6555 E Hannibal St, Mesa, AZ 85205 and is currently estimated at $519,146, approximately $309 per square foot. 6555 E Hannibal St is a home located in Maricopa County with nearby schools including Falcon Hill Elementary School, Franklin at Brimhall Elementary School, and Franklin West Elementary School.
Ownership History
Date
Name
Owned For
Owner Type
Purchase Details
Closed on
Dec 5, 2008
Sold by
Fox Marty A and Fox Jeanie R
Bought by
Leroy Richard N
Current Estimated Value
Home Financials for this Owner
Home Financials are based on the most recent Mortgage that was taken out on this home.
Original Mortgage
$217,134
Outstanding Balance
$145,833
Interest Rate
6.47%
Mortgage Type
FHA
Estimated Equity
$373,313
Purchase Details
Closed on
Jan 20, 2006
Sold by
Langer Howard and Langer Jean
Bought by
Fox Marty A and Fox Jeanie R
Home Financials for this Owner
Home Financials are based on the most recent Mortgage that was taken out on this home.
Original Mortgage
$332,479
Interest Rate
6.21%
Mortgage Type
New Conventional
Purchase Details
Closed on
Feb 21, 1996
Sold by
Langer Howard W
Bought by
Langer Howard and Langer Jean
Home Financials for this Owner
Home Financials are based on the most recent Mortgage that was taken out on this home.
Original Mortgage
$79,410
Interest Rate
7%
Create a Home Valuation Report for This Property
The Home Valuation Report is an in-depth analysis detailing your home's value as well as a comparison with similar homes in the area
Home Values in the Area
Average Home Value in this Area
Purchase History
| Date | Buyer | Sale Price | Title Company |
|---|---|---|---|
| Leroy Richard N | $220,000 | Security Title Agency | |
| Fox Marty A | $340,000 | Security Title Agency Inc | |
| Langer Howard | -- | First American Title | |
| Langer Howard W | -- | First American Title |
Source: Public Records
Mortgage History
| Date | Status | Borrower | Loan Amount |
|---|---|---|---|
| Open | Leroy Richard N | $217,134 | |
| Previous Owner | Fox Marty A | $332,479 | |
| Previous Owner | Langer Howard | $79,410 |
Source: Public Records
Tax History
| Year | Tax Paid | Tax Assessment Tax Assessment Total Assessment is a certain percentage of the fair market value that is determined by local assessors to be the total taxable value of land and additions on the property. | Land | Improvement |
|---|---|---|---|---|
| 2025 | $1,535 | $18,489 | -- | -- |
| 2024 | $1,552 | $17,608 | -- | -- |
| 2023 | $1,552 | $39,000 | $7,800 | $31,200 |
| 2022 | $1,518 | $30,210 | $6,040 | $24,170 |
| 2021 | $1,560 | $27,700 | $5,540 | $22,160 |
| 2020 | $1,539 | $25,650 | $5,130 | $20,520 |
| 2019 | $1,426 | $22,280 | $4,450 | $17,830 |
| 2018 | $1,361 | $18,620 | $3,720 | $14,900 |
| 2017 | $1,318 | $18,060 | $3,610 | $14,450 |
| 2016 | $1,295 | $13,900 | $2,780 | $11,120 |
| 2015 | $1,222 | $13,600 | $2,720 | $10,880 |
Source: Public Records
Map
Nearby Homes
- 6539 E Ingram St
- 1417 N 67th St
- 1461 N 63rd Place
- 1354 N Platina
- 1739 N Silverado
- 6420 E Jensen St
- 1423 N 62nd Place
- 1852 N Saffron Cir
- 6262 E Brown Rd Unit 71
- 6961 E Ivyglen St
- 1950 N 66th Place
- 1342 N 61st Place
- 1951 N 64th St Unit 56
- 1951 N 64th St Unit 51
- 1951 N 64th St Unit 55
- 6245 E Brown Rd
- 6462 E Fairfield St
- 6048 E Hobart St
- 6209 E Mckellips Rd Unit 128
- 6209 E Mckellips Rd Unit 306
- 6539 E Hannibal St
- 6546 E Hobart St
- 1513 N 66th St
- 6532 E Hobart St
- 6546 E Hannibal St
- 1525 N 66th St
- 6535 E Hannibal St
- 6516 E Hobart St
- 6545 E Mclellan Rd
- 6516 E Hannibal St
- 6531 E Mclellan Rd Unit 13
- 6531 E Mclellan Rd
- 1514 N 66th Place
- 6539 E Mclellan Rd
- 1526 N 66th Place
- 6545 E Hobart St
- 6601 E Mclellan Rd
- 1502 N 66th Place
- 6531 E Hobart St
- 1441 N 66th St
Your Personal Tour Guide
Ask me questions while you tour the home.