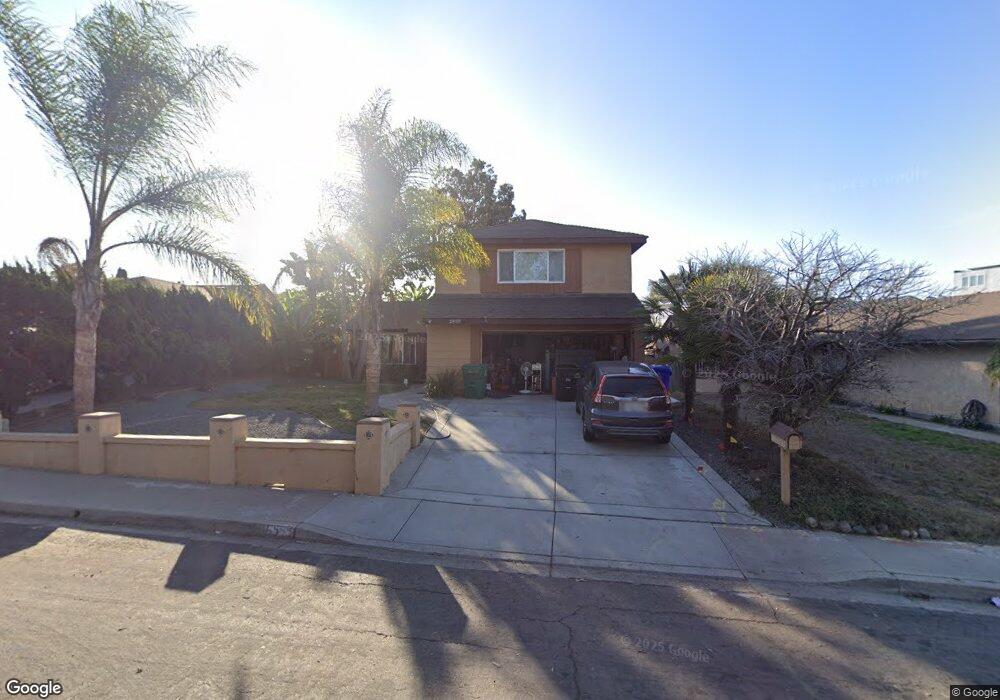
6555 High Knoll Rd San Diego, CA 92111
Linda Vista NeighborhoodEstimated Value: $1,033,000 - $1,286,000
4
Beds
3
Baths
1,687
Sq Ft
$671/Sq Ft
Est. Value
About This Home
This home is located at 6555 High Knoll Rd, San Diego, CA 92111 and is currently estimated at $1,132,231, approximately $671 per square foot. 6555 High Knoll Rd is a home located in San Diego County with nearby schools including Linda Vista Elementary School, Montgomery Middle School, and San Diego Cooperative Charter School.
Ownership History
Date
Name
Owned For
Owner Type
Purchase Details
Closed on
Dec 1, 2022
Sold by
Gladish David M
Bought by
Sunset Estates Llc
Current Estimated Value
Purchase Details
Closed on
Dec 1, 2020
Sold by
Sunset Estates Llc
Bought by
Gladish David M
Home Financials for this Owner
Home Financials are based on the most recent Mortgage that was taken out on this home.
Original Mortgage
$431,000
Interest Rate
2.7%
Mortgage Type
New Conventional
Purchase Details
Closed on
Apr 10, 2019
Sold by
Gladish David M
Bought by
Sunset Estates Llc
Purchase Details
Closed on
May 20, 2011
Sold by
Larson Rodney G
Bought by
Gladish David Mclean
Home Financials for this Owner
Home Financials are based on the most recent Mortgage that was taken out on this home.
Original Mortgage
$365,697
Interest Rate
4.55%
Mortgage Type
VA
Purchase Details
Closed on
Mar 3, 1989
Bought by
Larson Rodney G
Create a Home Valuation Report for This Property
The Home Valuation Report is an in-depth analysis detailing your home's value as well as a comparison with similar homes in the area
Home Values in the Area
Average Home Value in this Area
Purchase History
| Date | Buyer | Sale Price | Title Company |
|---|---|---|---|
| Sunset Estates Llc | -- | -- | |
| Gladish David M | -- | Elevated Title | |
| Sunset Estates Llc | -- | None Available | |
| Gladish David Mclean | $355,000 | Ticor Title Company Of Ca | |
| Larson Rodney G | $177,200 | -- |
Source: Public Records
Mortgage History
| Date | Status | Borrower | Loan Amount |
|---|---|---|---|
| Previous Owner | Gladish David M | $431,000 | |
| Previous Owner | Gladish David Mclean | $365,697 |
Source: Public Records
Tax History Compared to Growth
Tax History
| Year | Tax Paid | Tax Assessment Tax Assessment Total Assessment is a certain percentage of the fair market value that is determined by local assessors to be the total taxable value of land and additions on the property. | Land | Improvement |
|---|---|---|---|---|
| 2025 | $5,547 | $454,805 | $320,289 | $134,516 |
| 2024 | $5,547 | $445,888 | $314,009 | $131,879 |
| 2023 | $5,425 | $437,146 | $307,852 | $129,294 |
| 2022 | $5,280 | $428,575 | $301,816 | $126,759 |
| 2021 | $5,240 | $420,173 | $295,899 | $124,274 |
| 2020 | $5,173 | $415,865 | $292,865 | $123,000 |
| 2019 | $5,079 | $407,712 | $287,123 | $120,589 |
| 2018 | $4,668 | $399,719 | $281,494 | $118,225 |
| 2017 | $4,556 | $391,882 | $275,975 | $115,907 |
| 2016 | $4,478 | $384,199 | $270,564 | $113,635 |
| 2015 | $4,411 | $378,429 | $266,500 | $111,929 |
| 2014 | $4,341 | $371,017 | $261,280 | $109,737 |
Source: Public Records
Map
Nearby Homes
- 2868-70 Preece St
- 2818 Nye St
- 2750 Wheatstone St Unit 113
- 2750 Wheatstone St Unit 105
- 2750 Wheatstone St Unit 89
- 2750 Wheatstone St Unit 64
- 3161 Mount Tami Dr
- 3014 Old Bridgeport Way
- 2675 Comstock St
- 3262 Mount Carol Dr
- 6929 Park Mesa Way Unit 126
- 3226 Old Heather Rd
- 3047 Old Bridgeport Way
- 3120 Old Bridgeport Way
- 3270 W Fox Run Way Unit 2
- 6728 Thomson Ct
- 3298 Old Heather Rd
- 6328-30 Quillan St
- 3173 Via Arcilla
- 3218 Old Bridgeport Way
- 6545 High Knoll Rd
- 6565 High Knoll Rd
- 6535 High Knoll Rd
- 6574 Comly St
- 6575 High Knoll Rd
- 6584 Comly St
- 6568 Comly St
- 6525 High Knoll Rd
- 6585 High Knoll Rd
- 6592 Comly St Unit 94
- 6562 Comly St
- 6594 Comly St
- 6515 High Knoll Rd
- 6576 High Knoll Rd
- 6556 Comly St
- 6575 Comly St
- 6583 Comly St
- 6569 Comly St
- 6505 High Knoll Rd
- 6584 High Knoll Rd