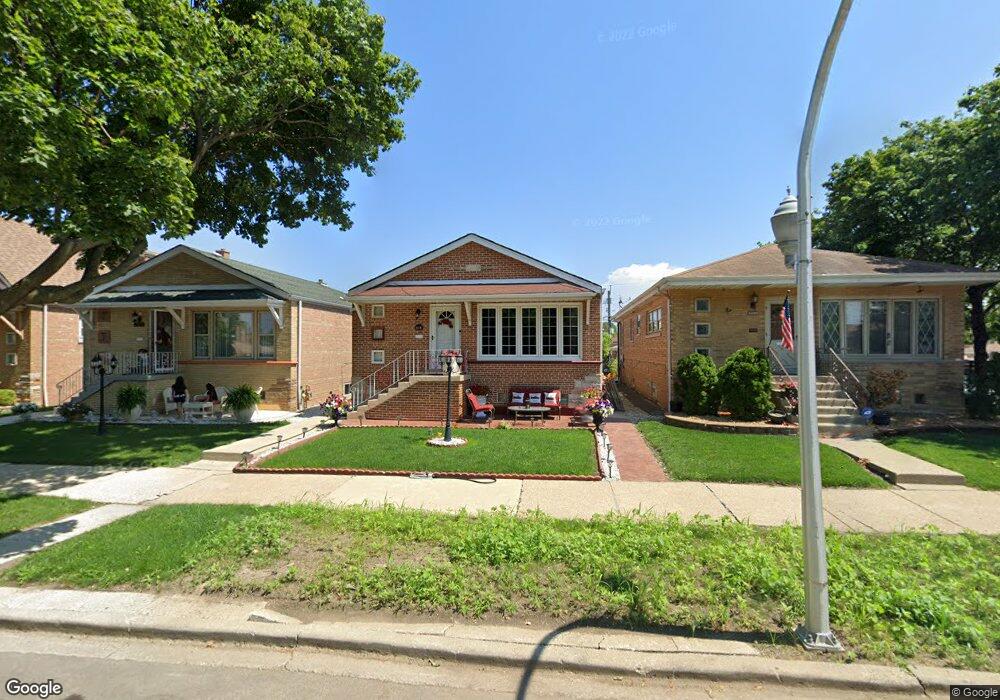
6555 S Kilbourn Ave Chicago, IL 60629
West Lawn NeighborhoodEstimated Value: $281,000 - $299,147
3
Beds
1
Bath
1,170
Sq Ft
$249/Sq Ft
Est. Value
About This Home
This home is located at 6555 S Kilbourn Ave, Chicago, IL 60629 and is currently estimated at $291,382, approximately $249 per square foot. 6555 S Kilbourn Ave is a home located in Cook County with nearby schools including Lee Elementary School, Hubbard High School, and St Mary Star Of The Sea School.
Ownership History
Date
Name
Owned For
Owner Type
Purchase Details
Closed on
Oct 25, 2005
Sold by
Gallarzo Jose G and Gallarzo Maria
Bought by
Enriquez Betvel
Current Estimated Value
Home Financials for this Owner
Home Financials are based on the most recent Mortgage that was taken out on this home.
Original Mortgage
$219,280
Outstanding Balance
$129,136
Interest Rate
7.29%
Mortgage Type
Unknown
Estimated Equity
$162,246
Purchase Details
Closed on
May 27, 2004
Sold by
Kois Jozef and Kois Anna
Bought by
Gallarzo Jose G and Gallarzo Maria
Home Financials for this Owner
Home Financials are based on the most recent Mortgage that was taken out on this home.
Original Mortgage
$205,000
Interest Rate
5.99%
Mortgage Type
Unknown
Purchase Details
Closed on
Jun 20, 1995
Sold by
Copenhaver Eileen Mcmahon
Bought by
Kois Jozef and Kois Anna
Home Financials for this Owner
Home Financials are based on the most recent Mortgage that was taken out on this home.
Original Mortgage
$96,800
Interest Rate
8.5%
Create a Home Valuation Report for This Property
The Home Valuation Report is an in-depth analysis detailing your home's value as well as a comparison with similar homes in the area
Home Values in the Area
Average Home Value in this Area
Purchase History
| Date | Buyer | Sale Price | Title Company |
|---|---|---|---|
| Enriquez Betvel | $91,500 | Pntn | |
| Gallarzo Jose G | $245,000 | Git | |
| Kois Jozef | $121,000 | -- |
Source: Public Records
Mortgage History
| Date | Status | Borrower | Loan Amount |
|---|---|---|---|
| Open | Enriquez Betvel | $219,280 | |
| Previous Owner | Gallarzo Jose G | $205,000 | |
| Previous Owner | Kois Jozef | $96,800 |
Source: Public Records
Tax History Compared to Growth
Tax History
| Year | Tax Paid | Tax Assessment Tax Assessment Total Assessment is a certain percentage of the fair market value that is determined by local assessors to be the total taxable value of land and additions on the property. | Land | Improvement |
|---|---|---|---|---|
| 2024 | $3,115 | $24,000 | $3,300 | $20,700 |
| 2023 | $3,016 | $18,000 | $4,125 | $13,875 |
| 2022 | $3,016 | $18,000 | $4,125 | $13,875 |
| 2021 | $2,950 | $18,000 | $4,125 | $13,875 |
| 2020 | $3,001 | $16,487 | $4,125 | $12,362 |
| 2019 | $3,052 | $18,525 | $4,125 | $14,400 |
| 2018 | $3,000 | $18,525 | $4,125 | $14,400 |
| 2017 | $2,667 | $15,683 | $3,712 | $11,971 |
| 2016 | $2,658 | $15,683 | $3,712 | $11,971 |
| 2015 | $2,411 | $15,683 | $3,712 | $11,971 |
| 2014 | $2,350 | $15,134 | $3,506 | $11,628 |
| 2013 | $2,293 | $15,134 | $3,506 | $11,628 |
Source: Public Records
Map
Nearby Homes
- 4521 W 64th St
- 6724 S Kolin Ave
- 6621 S Kilpatrick Ave
- 6731 S Kolin Ave
- 6615 S Keating Ave
- 6822 S Kenneth Ave
- 6432 S Kilpatrick Ave
- 6403 S Kilpatrick Ave
- 6710 S Keating Ave Unit 103
- 6354 S Keating Ave
- 6200 S Kolin Ave Unit 1
- 6330 S Karlov Ave
- 6146 S Knox Ave
- 6148 S Tripp Ave
- 6323 S Lamon Ave
- 6235 S Kedvale Ave
- 6053 S Kostner Ave
- 6039 S Kilbourn Ave
- 6316 S Laporte Ave
- 6435 S Lawler Ave
- 6551 S Kilbourn Ave
- 6559 S Kilbourn Ave
- 6549 S Kilbourn Ave
- 6545 S Kilbourn Ave
- 6541 S Kilbourn Ave
- 6601 S Kilbourn Ave Unit 1
- 6554 S Kenneth Ave
- 6552 S Kenneth Ave
- 6558 S Kenneth Ave
- 4500 W 66th St
- 6548 S Kenneth Ave
- 6546 S Kenneth Ave
- 6539 S Kilbourn Ave
- 6605 S Kilbourn Ave
- 6542 S Kenneth Ave
- 4504 W 66th St
- 6600 S Kenneth Ave
- 6535 S Kilbourn Ave
- 6540 S Kenneth Ave
- 6609 S Kilbourn Ave