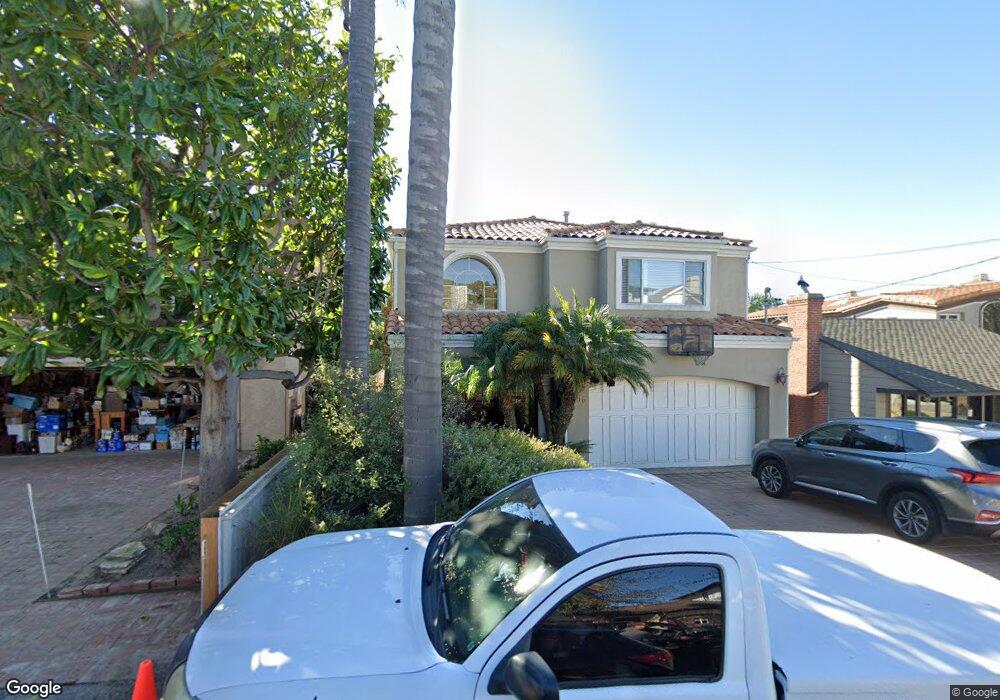
656 27th St Manhattan Beach, CA 90266
Estimated Value: $3,858,000 - $4,844,000
5
Beds
4
Baths
3,836
Sq Ft
$1,090/Sq Ft
Est. Value
About This Home
This home is located at 656 27th St, Manhattan Beach, CA 90266 and is currently estimated at $4,181,384, approximately $1,090 per square foot. 656 27th St is a home located in Los Angeles County with nearby schools including Grand View Elementary School, Manhattan Beach Middle School, and Mira Costa High School.
Ownership History
Date
Name
Owned For
Owner Type
Purchase Details
Closed on
May 5, 2009
Sold by
Spradlin Donald R
Bought by
Spradlin Donald R and Odonnell Jeri M
Current Estimated Value
Home Financials for this Owner
Home Financials are based on the most recent Mortgage that was taken out on this home.
Original Mortgage
$417,000
Outstanding Balance
$261,478
Interest Rate
4.71%
Mortgage Type
New Conventional
Estimated Equity
$3,919,906
Purchase Details
Closed on
Jun 17, 1998
Sold by
Spradlin Donald R
Bought by
Spradlin Donald R and Odonnell Jeri M
Purchase Details
Closed on
Feb 6, 1998
Sold by
Hilton Hugh
Bought by
Spradlin Donald R and Odonnell Jeri M
Home Financials for this Owner
Home Financials are based on the most recent Mortgage that was taken out on this home.
Original Mortgage
$585,000
Interest Rate
7.11%
Purchase Details
Closed on
Jun 26, 1995
Sold by
Hilton Hugh
Bought by
Hilton Hugh and Hilton Janet
Create a Home Valuation Report for This Property
The Home Valuation Report is an in-depth analysis detailing your home's value as well as a comparison with similar homes in the area
Home Values in the Area
Average Home Value in this Area
Purchase History
| Date | Buyer | Sale Price | Title Company |
|---|---|---|---|
| Spradlin Donald R | -- | Chicago Title Co | |
| Spradlin Donald R | -- | -- | |
| Spradlin Donald R | $870,000 | Lawyers Title Company | |
| Hilton Hugh | -- | -- |
Source: Public Records
Mortgage History
| Date | Status | Borrower | Loan Amount |
|---|---|---|---|
| Open | Spradlin Donald R | $417,000 | |
| Closed | Spradlin Donald R | $585,000 |
Source: Public Records
Tax History
| Year | Tax Paid | Tax Assessment Tax Assessment Total Assessment is a certain percentage of the fair market value that is determined by local assessors to be the total taxable value of land and additions on the property. | Land | Improvement |
|---|---|---|---|---|
| 2025 | $15,734 | $1,389,168 | $830,308 | $558,860 |
| 2024 | $15,734 | $1,361,930 | $814,028 | $547,902 |
| 2023 | $15,267 | $1,335,226 | $798,067 | $537,159 |
| 2022 | $15,002 | $1,309,046 | $782,419 | $526,627 |
| 2021 | $14,750 | $1,283,379 | $767,078 | $516,301 |
| 2019 | $14,352 | $1,245,315 | $744,327 | $500,988 |
| 2018 | $14,030 | $1,220,898 | $729,733 | $491,165 |
| 2016 | $13,153 | $1,173,492 | $701,398 | $472,094 |
| 2015 | $12,883 | $1,155,866 | $690,863 | $465,003 |
| 2014 | $12,707 | $1,133,225 | $677,330 | $455,895 |
Source: Public Records
Map
Nearby Homes
- 2623 Laurel Ave
- 605 Marine Ave
- 612 33rd St
- 592 33rd St
- 3112 Laurel Ave
- 661 19th St
- 461 26th St
- 1940 N Ardmore Ave
- 3013 Maple Ave
- 2917 N Poinsettia Ave
- 2921 N Poinsettia Ave
- 3604 Laurel Ave
- 436 32nd St
- 3619 Laurel Ave
- 2100 Palm Ave
- 323 31st St
- 2007 Highland Ave
- 316 32nd St
- 2407 Manhattan Ave
- 324 18th St
Your Personal Tour Guide
Ask me questions while you tour the home.