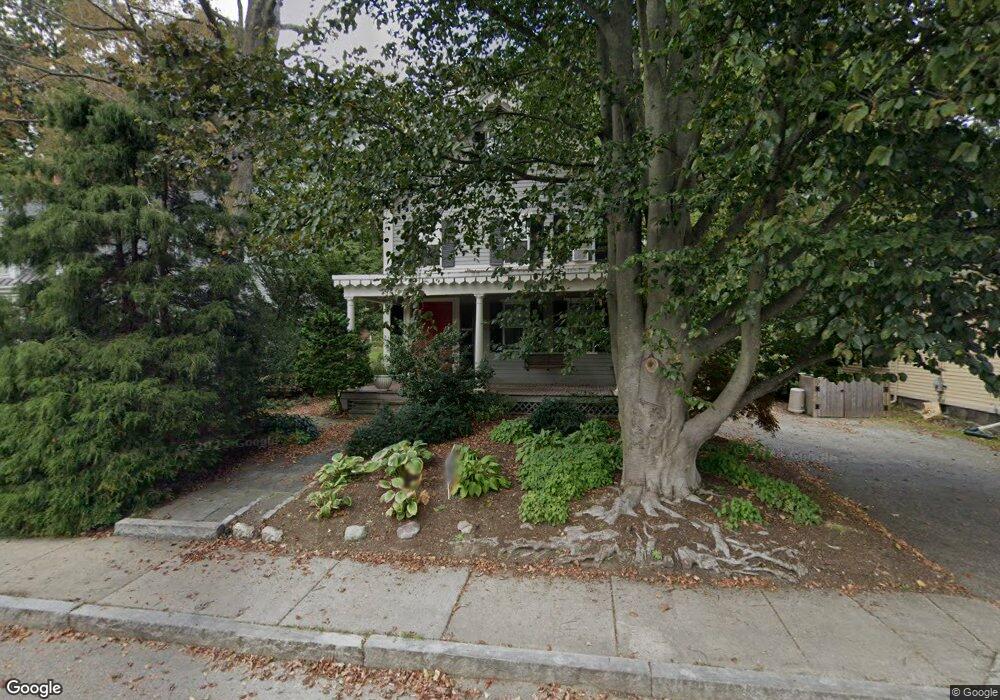
656 Grove St Newton Lower Falls, MA 02462
Newton Lower Falls NeighborhoodEstimated Value: $1,384,000 - $1,617,000
4
Beds
2
Baths
2,252
Sq Ft
$670/Sq Ft
Est. Value
About This Home
This home is located at 656 Grove St, Newton Lower Falls, MA 02462 and is currently estimated at $1,509,469, approximately $670 per square foot. 656 Grove St is a home located in Middlesex County with nearby schools including Angier Elementary School, Charles E Brown Middle School, and Newton South High School.
Ownership History
Date
Name
Owned For
Owner Type
Purchase Details
Closed on
Jul 9, 2021
Sold by
Cutright David R and Ramsey Juilie A
Bought by
D C Cutright T 2006
Current Estimated Value
Purchase Details
Closed on
Jun 17, 1986
Bought by
Cutright David R and Ramsey Julie A
Create a Home Valuation Report for This Property
The Home Valuation Report is an in-depth analysis detailing your home's value as well as a comparison with similar homes in the area
Home Values in the Area
Average Home Value in this Area
Purchase History
| Date | Buyer | Sale Price | Title Company |
|---|---|---|---|
| D C Cutright T 2006 | -- | None Available | |
| Cutright David R | -- | -- |
Source: Public Records
Mortgage History
| Date | Status | Borrower | Loan Amount |
|---|---|---|---|
| Previous Owner | Cutright David R | $200,000 | |
| Previous Owner | Cutright David R | $400,000 | |
| Previous Owner | Cutright David R | $32,000 |
Source: Public Records
Tax History Compared to Growth
Tax History
| Year | Tax Paid | Tax Assessment Tax Assessment Total Assessment is a certain percentage of the fair market value that is determined by local assessors to be the total taxable value of land and additions on the property. | Land | Improvement |
|---|---|---|---|---|
| 2025 | $14,973 | $1,527,900 | $893,500 | $634,400 |
| 2024 | $14,478 | $1,483,400 | $867,500 | $615,900 |
| 2023 | $13,535 | $1,329,600 | $677,500 | $652,100 |
| 2022 | $12,951 | $1,231,100 | $627,300 | $603,800 |
| 2021 | $12,497 | $1,161,400 | $591,800 | $569,600 |
| 2020 | $12,125 | $1,161,400 | $591,800 | $569,600 |
| 2019 | $11,783 | $1,127,600 | $574,600 | $553,000 |
| 2018 | $11,126 | $1,028,300 | $512,400 | $515,900 |
| 2017 | $10,788 | $970,100 | $483,400 | $486,700 |
| 2016 | $10,317 | $906,600 | $451,800 | $454,800 |
| 2015 | $9,837 | $847,300 | $422,200 | $425,100 |
Source: Public Records
Map
Nearby Homes
- 45 Moulton St
- 25 Columbia St
- 7 Crescent St
- 45 E Quinobequin Rd
- 17 Deforest Rd
- 2084 Washington St
- 34 Palmer Rd
- 2 Longfellow Rd
- 177 Varick Rd
- 12 Bird Hill Ave
- 10 Bird Hill Ave
- 10 Lorraine Cir
- 8 Old Town Rd
- 20 Oakland Street Front
- 33 Metacomet Rd
- 27 Oakwood Rd
- 1801 Beacon St
- 6 Oakland Cir
- 54 Colburn Rd
- 135 Orchard Ave