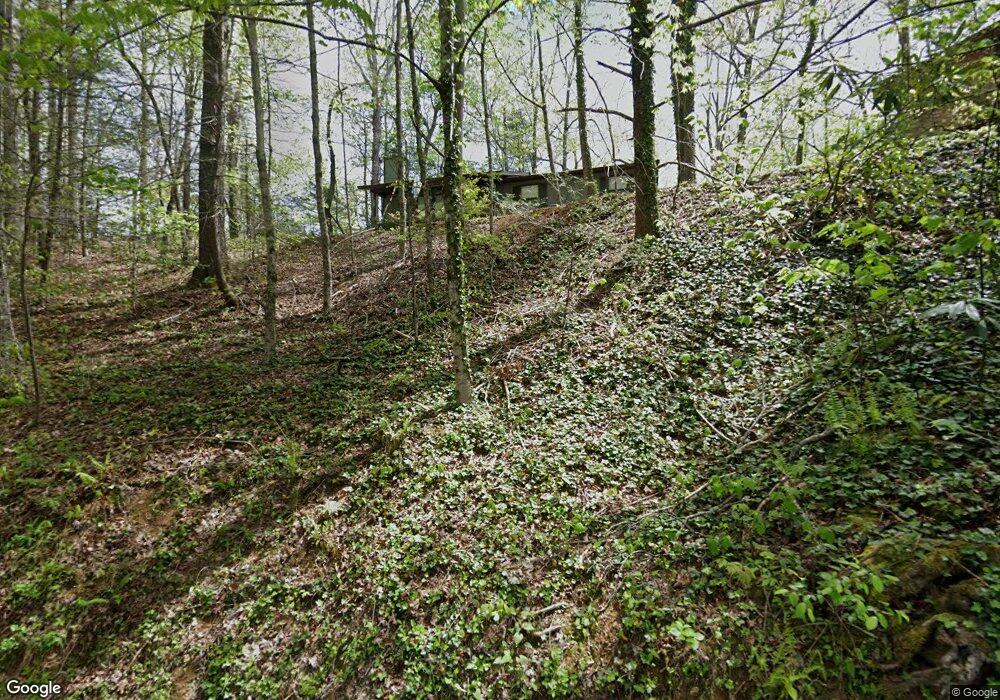
656 Ownby Dr Gatlinburg, TN 37738
Estimated Value: $278,000 - $303,220
--
Bed
2
Baths
1,276
Sq Ft
$228/Sq Ft
Est. Value
About This Home
This home is located at 656 Ownby Dr, Gatlinburg, TN 37738 and is currently estimated at $290,610, approximately $227 per square foot. 656 Ownby Dr is a home located in Sevier County with nearby schools including Catons Chapel Elementary School, Jones Cove Elementary School, and Northview Elementary School.
Ownership History
Date
Name
Owned For
Owner Type
Purchase Details
Closed on
Jan 18, 2022
Sold by
Emily Grooms
Bought by
Seavy Amy M
Current Estimated Value
Home Financials for this Owner
Home Financials are based on the most recent Mortgage that was taken out on this home.
Original Mortgage
$65,000
Outstanding Balance
$18,332
Interest Rate
3.11%
Mortgage Type
New Conventional
Estimated Equity
$272,278
Purchase Details
Closed on
Jul 19, 2007
Sold by
Barry James J
Bought by
Femily Grooms
Purchase Details
Closed on
Feb 2, 2004
Sold by
Joseph Montesi Albert
Bought by
Montesi Albert Joseph Trustee
Purchase Details
Closed on
Mar 21, 2000
Sold by
Odle Frank P
Bought by
Montesi Albert J
Purchase Details
Closed on
Nov 8, 1988
Bought by
Odle Frank P
Purchase Details
Closed on
Jun 16, 1988
Bought by
Rogers Vida B
Create a Home Valuation Report for This Property
The Home Valuation Report is an in-depth analysis detailing your home's value as well as a comparison with similar homes in the area
Home Values in the Area
Average Home Value in this Area
Purchase History
| Date | Buyer | Sale Price | Title Company |
|---|---|---|---|
| Seavy Amy M | $200,000 | Smoky Mountain Title | |
| Seavy Amy M | $200,000 | Smoky Mountain Title | |
| Femily Grooms | -- | -- | |
| Montesi Albert Joseph Trustee | -- | -- | |
| Montesi Albert J | $98,000 | -- | |
| Odle Frank P | $65,500 | -- | |
| Rogers Vida B | $60,000 | -- |
Source: Public Records
Mortgage History
| Date | Status | Borrower | Loan Amount |
|---|---|---|---|
| Open | Seavy Amy M | $65,000 | |
| Closed | Seavy Amy M | $65,000 |
Source: Public Records
Tax History Compared to Growth
Tax History
| Year | Tax Paid | Tax Assessment Tax Assessment Total Assessment is a certain percentage of the fair market value that is determined by local assessors to be the total taxable value of land and additions on the property. | Land | Improvement |
|---|---|---|---|---|
| 2025 | $662 | $44,750 | $7,875 | $36,875 |
| 2024 | $662 | $44,750 | $7,875 | $36,875 |
| 2023 | $662 | $44,750 | $0 | $0 |
| 2022 | $718 | $44,750 | $7,875 | $36,875 |
| 2021 | $718 | $44,750 | $7,875 | $36,875 |
| 2020 | $544 | $44,750 | $7,875 | $36,875 |
| 2019 | $545 | $26,975 | $7,875 | $19,100 |
| 2018 | $545 | $26,975 | $7,875 | $19,100 |
| 2017 | $545 | $26,975 | $7,875 | $19,100 |
| 2016 | $545 | $26,975 | $7,875 | $19,100 |
| 2015 | -- | $29,350 | $0 | $0 |
| 2014 | $525 | $29,348 | $0 | $0 |
Source: Public Records
Map
Nearby Homes
- 0 King Rd Unit 1299069
- 662 Morning Mist Way
- 661 Morning Mist Way
- 659 Morning Mist Way
- 626 Morning Mist Way
- 638 Morning Mist Way
- 1633 Cardinal Dr
- 459 Ownby Cir
- 315 Robin Ln
- 556 N Ownby Dr
- 1106 Anastasia Way
- 0 Ownby Cir Unit 308755
- 1104 Anastasia Way
- 1132 Anastasia Way
- 1123 Anastasia Way
- 1128 Anastasia Way
- 1115 Anastasia Way
- 1745 Mountain Shadows Way
- 510 Branson Dr
- 652 Ownby Dr
- 646 Ownby Dr
- 506 Bettis Dr
- 345 King Rd Unit VIC
- 0 Ownby Dr
- Parcel 5 King Rd
- 649 Ownby Dr
- Lot 5 King Rd
- 0 King Rd Unit 1298935
- 0 King Rd Unit 256566
- 0 King Rd
- 640 Ownby Dr
- 340B King Rd
- 340 King Rd Unit 340A
- 512 Bettis Dr
- 668 Ownby Dr
- 620 Olde Carraige Rd
- 1618 Selma Dr
- Lot 67 Ownby Dr
- Lot 42 Ownby Dr