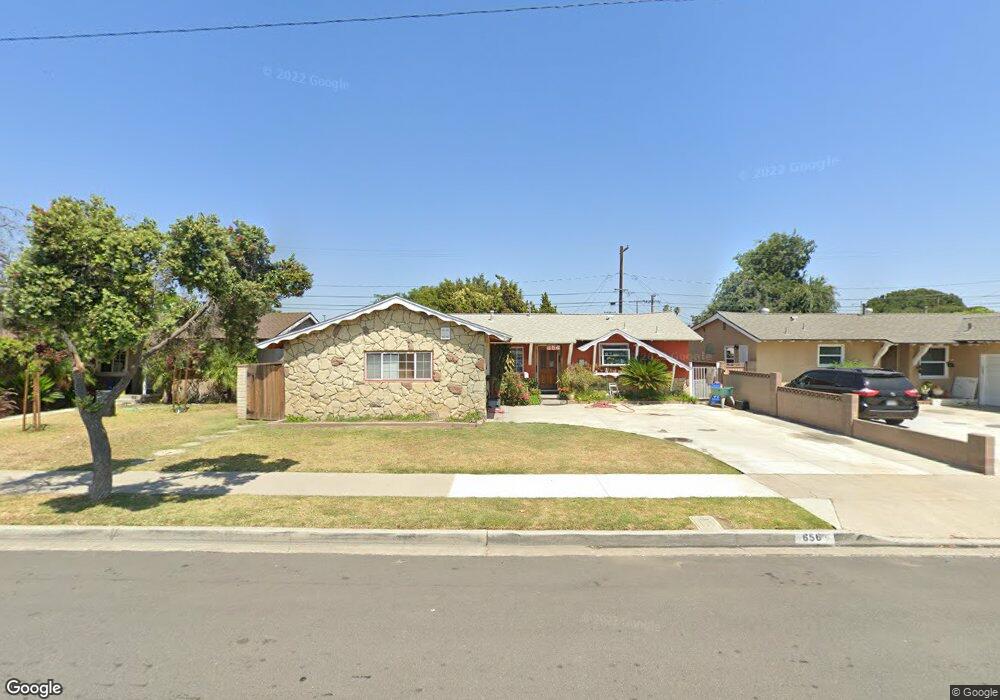
656 S Bruce St Anaheim, CA 92804
West Anaheim NeighborhoodEstimated Value: $876,000 - $1,159,000
4
Beds
2
Baths
1,223
Sq Ft
$785/Sq Ft
Est. Value
About This Home
This home is located at 656 S Bruce St, Anaheim, CA 92804 and is currently estimated at $959,476, approximately $784 per square foot. 656 S Bruce St is a home located in Orange County with nearby schools including Walt Disney Elementary School, Dale Jr High School, and Magnolia High.
Ownership History
Date
Name
Owned For
Owner Type
Purchase Details
Closed on
Apr 30, 2018
Sold by
Felix Enrique and Navarro Maria Regina Castro
Bought by
Felix Enrique and Nunez Joaquin
Current Estimated Value
Home Financials for this Owner
Home Financials are based on the most recent Mortgage that was taken out on this home.
Original Mortgage
$308,000
Outstanding Balance
$265,503
Interest Rate
4.45%
Mortgage Type
New Conventional
Estimated Equity
$693,973
Purchase Details
Closed on
May 29, 1997
Sold by
Liang Lin Yan and Hwan Li Hwan
Bought by
Felix Enrique
Home Financials for this Owner
Home Financials are based on the most recent Mortgage that was taken out on this home.
Original Mortgage
$155,844
Interest Rate
7.94%
Mortgage Type
FHA
Purchase Details
Closed on
May 10, 1993
Sold by
Lin David Ta Yao
Bought by
Lin Yan Liang and Lin Li Hwan
Create a Home Valuation Report for This Property
The Home Valuation Report is an in-depth analysis detailing your home's value as well as a comparison with similar homes in the area
Home Values in the Area
Average Home Value in this Area
Purchase History
| Date | Buyer | Sale Price | Title Company |
|---|---|---|---|
| Felix Enrique | -- | Lawyers Title | |
| Felix Enrique | $159,000 | Gateway Title Company | |
| Lin Yan Liang | $220,000 | -- |
Source: Public Records
Mortgage History
| Date | Status | Borrower | Loan Amount |
|---|---|---|---|
| Open | Felix Enrique | $308,000 | |
| Closed | Felix Enrique | $155,844 |
Source: Public Records
Tax History Compared to Growth
Tax History
| Year | Tax Paid | Tax Assessment Tax Assessment Total Assessment is a certain percentage of the fair market value that is determined by local assessors to be the total taxable value of land and additions on the property. | Land | Improvement |
|---|---|---|---|---|
| 2025 | $5,140 | $448,063 | $369,539 | $78,524 |
| 2024 | $5,140 | $439,278 | $362,293 | $76,985 |
| 2023 | $5,007 | $430,665 | $355,189 | $75,476 |
| 2022 | $4,959 | $422,221 | $348,224 | $73,997 |
| 2021 | $4,900 | $413,943 | $341,396 | $72,547 |
| 2020 | $4,873 | $409,699 | $337,895 | $71,804 |
| 2019 | $4,753 | $401,666 | $331,269 | $70,397 |
| 2018 | $2,863 | $227,582 | $154,905 | $72,677 |
| 2017 | $5,670 | $223,120 | $151,868 | $71,252 |
| 2016 | $2,751 | $218,746 | $148,891 | $69,855 |
| 2015 | $2,727 | $215,461 | $146,655 | $68,806 |
| 2014 | $2,595 | $211,241 | $143,782 | $67,459 |
Source: Public Records
Map
Nearby Homes
- 9531 Orange Ave
- 2517 W Merle Place
- 927 S Webster Ave
- 2217 W Orange Ave
- 9791 Orange Ave
- 958 S Crossbow Ln Unit 8
- 998 S Crossbow Ln Unit 12D
- 2435 W Broadway
- 2245 W Vancouver Dr
- 917 S Sutter Creek Rd Unit 46
- 2550 W Rowland Ave
- 938 S Sutter Creek Rd Unit 54
- 994 S Sutter Creek Rd Unit 60
- 2513 W Fulcrum Place
- 2432 W Transit Ave
- 2211 W Orange Ave
- 837 S Magnolia Ave
- Plan 4 at Townes at Orange
- 13252 Brookhurst St Unit 26
- Plan 1 at Townes at Orange
- 652 S Bruce St
- 702 S Bruce St
- 657 S Gilbert St
- 648 S Bruce St
- 706 S Bruce St
- 653 S Gilbert St
- 703 S Gilbert St
- 649 S Gilbert St
- 707 S Gilbert St
- 701 S Bruce St
- 655 S Bruce St
- 644 S Bruce St
- 710 S Bruce St
- 705 S Bruce St
- 651 S Bruce St
- 645 S Gilbert St
- 711 S Gilbert St
- 709 S Bruce St
- 647 S Bruce St
- 640 S Bruce St