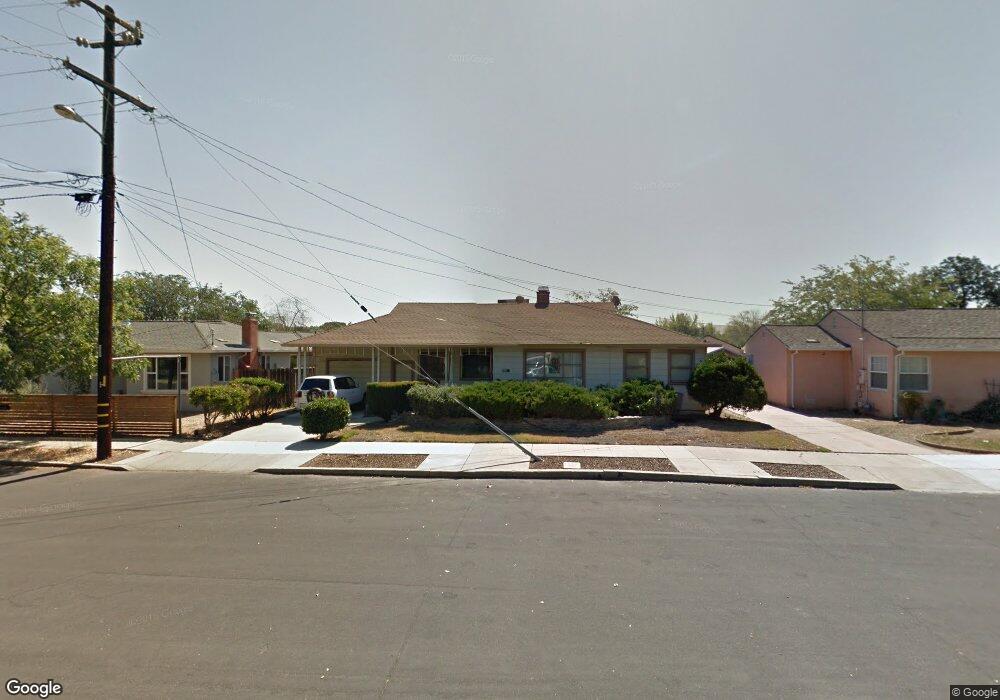
656 S S St Livermore, CA 94550
Estimated Value: $796,000 - $1,045,000
3
Beds
2
Baths
1,225
Sq Ft
$745/Sq Ft
Est. Value
About This Home
This home is located at 656 S S St, Livermore, CA 94550 and is currently estimated at $912,979, approximately $745 per square foot. 656 S S St is a home located in Alameda County with nearby schools including William Mendenhall Middle School, Granada High School, and St Michael's School.
Ownership History
Date
Name
Owned For
Owner Type
Purchase Details
Closed on
Dec 14, 2022
Sold by
Norleen Beverly
Bought by
Beverly Norleen Separate Property Trust and Norleen
Current Estimated Value
Purchase Details
Closed on
Jan 19, 2021
Sold by
Crowley Betty Jean and 2000 Crowley Family Trust
Bought by
Norleen Beverly
Purchase Details
Closed on
Nov 5, 2020
Sold by
Jaeger Lauren
Bought by
Crowley Beverly and Crowley Betty Jean
Purchase Details
Closed on
Jan 22, 2014
Sold by
Crowley Betty Jean and Crowley Patrick W
Bought by
2000 Crowley Family Trust
Purchase Details
Closed on
Dec 17, 2001
Sold by
Crowley Betty Jean and The 2000 Crowley Family Trust
Bought by
Jaeger Lauren
Purchase Details
Closed on
Feb 23, 2001
Sold by
Williams Carol and Williams Clay
Bought by
Jaeger Lauren
Purchase Details
Closed on
Sep 22, 2000
Sold by
Norleen Beverly
Bought by
Norleen Beverly
Purchase Details
Closed on
Feb 13, 1998
Sold by
Williams Ella M
Bought by
Delane Harabadian Savanna and Delane Paul
Create a Home Valuation Report for This Property
The Home Valuation Report is an in-depth analysis detailing your home's value as well as a comparison with similar homes in the area
Purchase History
| Date | Buyer | Sale Price | Title Company |
|---|---|---|---|
| Beverly Norleen Separate Property Trust | -- | None Listed On Document | |
| Norleen Beverly | -- | None Available | |
| Crowley Beverly | $300,000 | None Available | |
| 2000 Crowley Family Trust | -- | None Available | |
| Jaeger Lauren | -- | -- | |
| Jaeger Lauren | $133,500 | Old Republic Title Company | |
| Williams Clay | -- | Old Republic Title Company | |
| Norleen Beverly | -- | -- | |
| Delane Harabadian Savanna | -- | -- |
Source: Public Records
Tax History
| Year | Tax Paid | Tax Assessment Tax Assessment Total Assessment is a certain percentage of the fair market value that is determined by local assessors to be the total taxable value of land and additions on the property. | Land | Improvement |
|---|---|---|---|---|
| 2025 | $6,824 | $510,183 | $143,313 | $366,870 |
| 2024 | $6,824 | $500,182 | $140,504 | $359,678 |
| 2023 | $6,716 | $490,377 | $137,750 | $352,627 |
| 2022 | $6,614 | $480,763 | $135,049 | $345,714 |
| 2021 | $5,386 | $441,336 | $132,401 | $308,935 |
| 2020 | $4,833 | $346,276 | $103,883 | $242,393 |
| 2019 | $4,843 | $339,487 | $101,846 | $237,641 |
| 2018 | $4,727 | $332,832 | $99,850 | $232,982 |
| 2017 | $4,597 | $326,307 | $97,892 | $228,415 |
| 2016 | $4,412 | $319,910 | $95,973 | $223,937 |
| 2015 | $4,146 | $315,107 | $94,532 | $220,575 |
| 2014 | $4,070 | $308,937 | $92,681 | $216,256 |
Source: Public Records
Map
Nearby Homes
- 1087 Murrieta Blvd Unit 243
- 1087 Murrieta Blvd Unit 245
- 1087 Murrieta Blvd Unit 242
- 1085 Murrieta Blvd Unit 222
- 1085 Murrieta Blvd Unit 124
- 1085 Murrieta Blvd Unit 318
- 1085 Murrieta Blvd Unit 324
- 1421 3rd St
- 1543 4th St
- 1009 Lisbon Ave
- 1030 Via Madrid
- 975 Murrieta Blvd
- 1144 El Dorado Dr
- 589 S M St
- 879 Grace St
- 1385 Lambaren Ave
- 955 Ventura Ave
- 974 Ventura Ave
- 1277 Olivina Ave
- 157 Zephyr Place Unit 109